16

I'm redoing my firewall configuration with more restrictive policies and I would like to determine the provenance (and/or destination) of some outgoing connections.

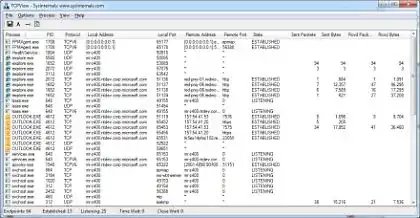
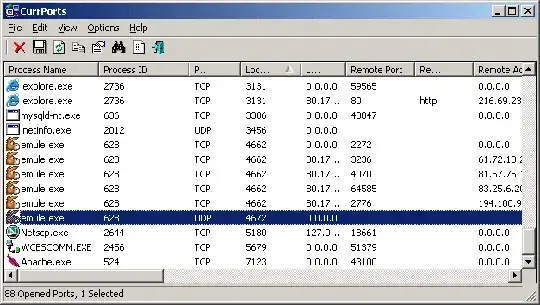
I have an issue because they come from svchost.exe and go to web content/application delivery providers - or similar:

5 IP in range: 82.96.58.0 - 82.96.58.255      --> Akamai Technologies         akamaitechnologies.com
3 IP in range: 93.150.110.0 - 93.158.111.255  --> Akamai Technologies         akamaitechnologies.com
2 IP in range: 87.248.194.0 - 87.248.223.255  --> LLNW Europe 2               llnw.net
205.234.175.175                               --> CacheNetworks, Inc.         cachefly.net
188.121.36.239                                --> Go Daddy Netherlands B.V.   secureserver.net

So is it possible to know which service does a particular connection? Or what's your recommendation about the rules applied to these ones?

(Comodo Firewall & Windows 7)

Update:

netstat -ano & tasklist /svc help me a little but they are many services in one svchost.exe so it's still an issue. moreover the service names returned by "tasklist /svc" are not easy readable.

(All the connections are HTTP (port 80) but I don't think it's relevant)

fluxtendu
  • 7,219

8 Answers8

10

SysInternals Process Explorer can do this for you.

Open the process properties of the svchost.exe instance you are trying to analyze. Click on the TCP/IP tab. Double click on the connection you are wanting to discover to bring up a stack trace of the connection. You should be able to trace the stack back to the DLL that implements the service. Here is an excerpt from the help file on the topic of Process Properites:

TCP/IP:

Any active TCP and UDP endpoints owned by the process are shown on this page.

On Windows XP SP2 and higher this page includes a Stack button that opens a dialog that shows the stack of the thread that opened the selected endpoint at the time of the open. This is useful for identifying the purpose of endpoints in the System process and Svchost processes because the stack will include the name of the driver or service that is responsible for the endpoint

Also on Configuring Symbols

Configure Symbols: on Windows NT and higher, if you want Process Explorer to resolve addresses for thread start addresses in the threads tab of the process properties dialog and the thread stack window then configure symbols by first downloading the Debugging Tools for Windows package from Microsoft's web site and installing it in its default directory. Open the Configure Symbols dialog and specify the path to the dbghelp.dll that's in the Debugging Tools directory and have the symbol engine download symbols on demand from Microsoft to a directory on your disk by entering a symbol server string for the symbol path. For example, to have symbols download to the c:\symbols directory you would enter this string:

srvc:\symbolshttp://msdl.microsoft.com/download/symbols

Note: You may need to run Process Explorer as administrator to be able to see the thread's stack.

heavyd
  • 65,321
9

I have found a method in this Server Fault answer (about services and memory usage) that I could use to analyze individually the network usage of services (with any network tool)

Peter Mortensen:

Split each service to run in its own SVCHOST.EXE process and the service consuming the CPU cycles will be easily visible in Task Manager or Process Explorer (the space after "=" is required):

SC Config Servicename Type= own

Do this in a command line window or put it into a BAT script. Administrative privileges are required and a restart of the computer is required before it takes effect.

The original state can be restored by:

SC Config Servicename Type= share
fluxtendu
  • 7,219
3

I know this may be outdated, but still this page ranks high in search for "svchost connections", so I'll toss my input here. There is tool called Svchost Process Analyzer, it may help: https://www.neuber.com/free/svchost-analyzer/index.html

AKsik
  • 31
2

Try using tasklist /svc and netstat or netstat -an from the command line.

This will show you the programs that are using svchost.exe and the ports being. Using the port numbers, you may be able to look up the protocol that commonly uses the number. See List of TCP and UDP port numbers.

bugtussle
  • 355
2

TCPView is a graphic tool that will show you the service, PID, and TCP connection (both local and remote):

Screenshot of TCPView

harrymc
  • 498,455
1

As mentioned, find the svchost PID of given svchost process and/or use 3rd party apps like: Currports, ProcessExplorer will help you identify services under the given process (svchost.exe or anything else). Also, Svchost Viewer or Svchost Analyzer will strictly show you svchost info as well.

I also wanted to add: Newer versions of the builtin Windows Task Manager will at least show show you some limited information on services running under svchost (no need to install anything) :

First, pick the svchost process under Processes.
Right-click given svchost process and pick "Go to Service(s)"
It will go directly to services tab and highlight given services running under that svchost process.

Another method:
Using administrator CMD prompt:
tasklist /svc /fi "IMAGENAME eq svchost.exe" > svchost_services.txt
notepad svchost_services.txt
This is also a quick way to get the PID of given svchost/service in question.

B. Shea
  • 1,388
1

Use the task manager to view the PID columns for each process in the process list. Then run netstat -ano to view the active connections and associated PID (= process id).

1

The NirSoft utility CurrPorts does everything you want, including filtering and giving the list of services of a process.

In fact, the only problem with it is how to choose among the enormous number of information columns that it can potentially display.

Screenshot of CurrPorts utility

harrymc
  • 498,455