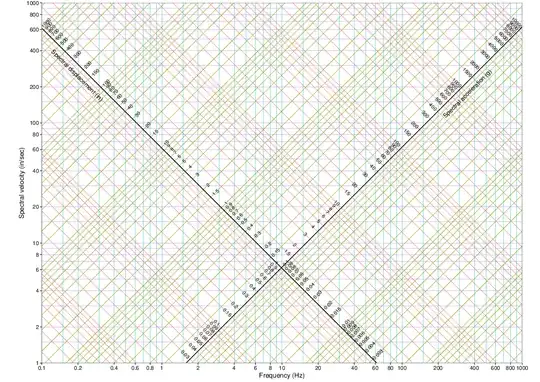
I want to create a very custom grid for an Excel chart. I am trying to create a grid system like this:
It's called a tripartite graph. For the vertical and horizontal gridlines it's easy, I just have to set the axis to be in logarithmic scale. But for the diagonal gridlines, I have to create them myself, line by line. For each line I can calculate the coordinates of the starting and ending point. But how can I set up my data in a way that I can produce all the lines at once?
In order to draw a line, I need at least two points (starting and ending point), so four coordinates in total (X1, Y1, X2, Y2). Probably, each line will be a series.
Is there any way that I can massively create all the series at once?
Maybe have the data in the following format:
Series1   X1  X2  Y1  Y2
Series2   X1  X2  Y1  Y2
and so on...
Any ideas?
