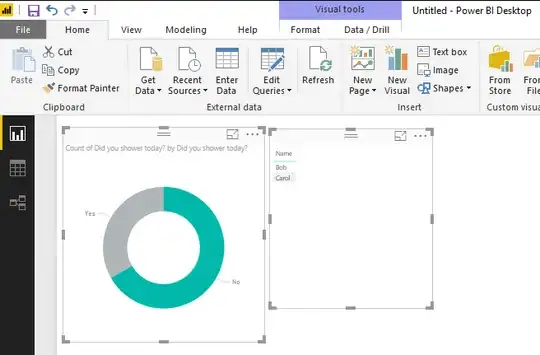
I'm creating a PowerBI presentation that pulls data from a SharePoint list. The list has columns that correspond to questions from a form, and rows that correspond to individual items (i.e., each time someone fills out the form, it creates a new row in the table that contains their answer to each question).
Below is an example table showing what this looks like (using made up questions and data for privacy reasons):
For most purposes, I want to query an individual question (i.e., a column), and be presented with a list of items. This is easy: If I want to know who didn't shower today, I just make a donut chart, fill in Column B in its Legend and Values fields, and then create a table next to it with Column A in its Values field. Now, I've got a donut chart showing me that 2/3 of respondents haven't showered today, and if I click on the "no" section of the chart, Alice disappears from the table, revealing that Bob and Carol are the gross ones:
However, for one element of the presentation, I want to do the reverse: Allow someone to specify an item, and look up corresponding questions. Specifically, I want to be able to check which fields were left blank on a specific item. It's not obvious to me how to do this, because field names (which are what I'm using to represent the questions) aren't something PowerBI seems to expect you to need to look up.
Is there any way to create a visualization or set of visualizations that will present a list of values from one column (e.g., a list of names in the example table above), and when a specific name is clicked on, show a list of fields that were left blank in the item with that name?

