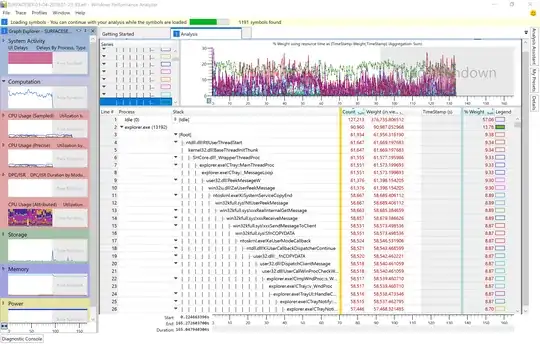
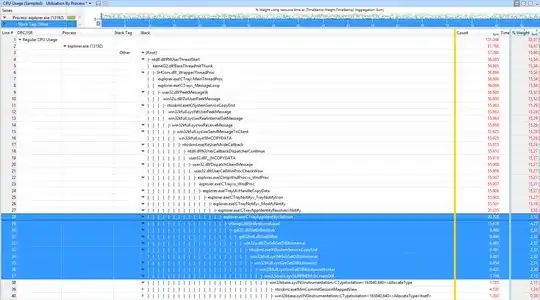
following a very similar thread here - I am posting the screenshot of ETL analysis in Windows Performance Analyzer.
EDIT: ETL file is here as RAR file captured on Windows version 1709 OS Build 16299.192 using today's WPR (just downloaded) and Analyzer 10.0.16299.91
Follows is the screenshot shows like 20+ levels of stack of what is causing it... I am afraid I am not sure how to figure out the cause from various function names being called... I've also completed loading the symbols, but they dont seem to help make sense of what causes it.
I've gone up to like row 48 in stack depth, and still not a clue...
Can anyone please help?

