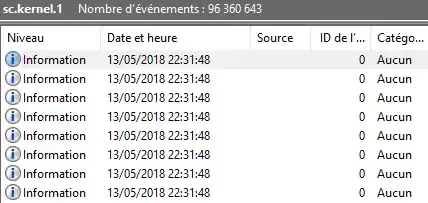
[EDIT : Opened the files in the event logger]
It seems that the error are logged really often : Error 15003 seems to be a driver error, though no yellow ! shows up in the peripheral manager.
- <Event xmlns="http://schemas.microsoft.com/win/2004/08/events/event">
- <System>
  <Provider Name="" Guid="{ce1dbfb4-137e-4da6-87b0-3f59aa102cbc}" />
  <EventID>0</EventID>
  <Version>2</Version>
  <Level>0</Level>
  <Task>0</Task>
  <Opcode>46</Opcode>
  <Keywords>0x0</Keywords>
  <TimeCreated SystemTime="2018-05-13T20:31:48.544092000Z" />
  <EventRecordID>96360642</EventRecordID>
  <Correlation />
  <Execution ProcessID="4294967295" ThreadID="4294967295" ProcessorID="0" KernelTime="0" UserTime="0" />
  <Channel />
  <Computer>XXXXXXXX</Computer>
  <Security />
  </System>
- <ProcessingErrorData>
  <ErrorCode>15003</ErrorCode>
  <DataItemName />
  <EventPayload>4EAA0F0C00000000FC31000001005000</EventPayload>
  </ProcessingErrorData>
  </Event>
[Initial post]
My main hard drive gets saturated weekly and I have to delete those files manually. Does somebody know where it comes from ?
Software I use on a daily basis : Photoshop, Unity3D, Chrome, Visual studio, Visual code and ConEmu
Temps files are all named sc.kernel.[Number].etl didn't find anything on the subject.
I scanned the computer with windows defender as well, no results.

