0

Is it ok to cross post this question?

I am struggling with creating a count table of two variables at the same time. Ultimately, I would like to create a bar graph of the table.

Assuming I have two items for a sample of firms and I just want a summary table of the answer count.

Firm       Item1    Item2
1          1        1
2          2        1
3          1        2
4          1        2

Based on this answer, I can easily create the summary table for Item 1 telling me that "1" appears three times for item 1 and two times in Item 2. But I cant easily create a Pivot table showing this jointly.

To clarify what I would like I added two screenshots (Excel unfortunately in German) enter image description here
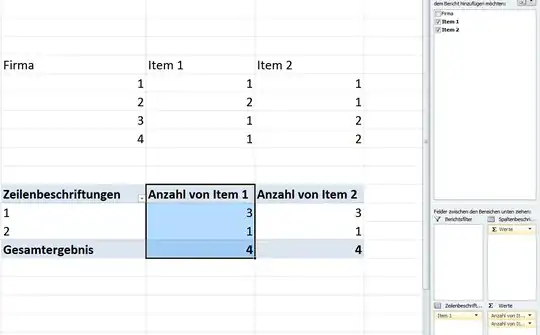
This is where it does not work, because he uses the values of Item 1 to count for item 2.

One solution would be to go long, but I would not know an easy way to do this in Excel for a more elaborate data set.
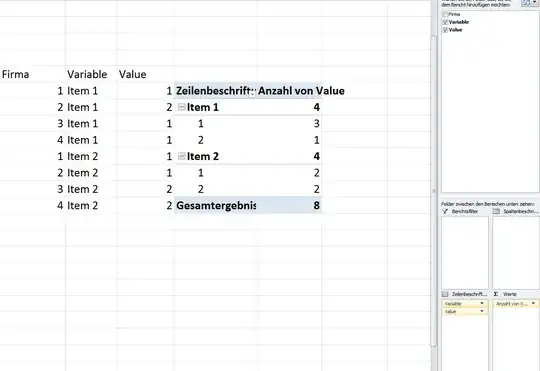
enter image description here

Max M
  • 125

1 Answers1

0

Your proposed solution is the right way to follow.

You have to "unpivot" your Inputs in this tabular form in order to use the Excel pivot function efficiently.

company | variable | value.

If you got your raw data in the first form

company | value variable 1 | value variable 2 | value variable 3 | ....

then the best (and probably easiest) way is to transform / unpivot the raw inputs using the Power Query functionality of Excel (Get & Transform, up to Excel 2013 as Addin Power Query).

Follow these steps:

  • Import your data in Power Query (define your Inputs as table)
    Go to Data > Get & Transform > From Table (Excel 2016) or Power Query > Excel Data > From Table (Excel 2013 & 2010)
  • select the column company (or if you have more which you want to Keep)
  • on the transform tab, right click on unpivot column. Choose the Option unpivot other columns
  • Click Close & Load from the Home tab

Here the M-Code which will be generated by the UI

let
    Source = Excel.CurrentWorkbook(){[Name="Tabelle1"]}[Content],
    #"Changed Type" = Table.TransformColumnTypes(Source,{{"Company", Int64.Type}, {"1", type text}, {"2", type text}, {"3", type text}}),
    #"Unpivoted Other Columns" = Table.UnpivotOtherColumns(#"Changed Type", {"Company"}, "Attribut", "Wert")
in
    #"Unpivoted Other Columns"  

You can also follow a good tutorial here.

visu-l
  • 466
  • 2
  • 9