I think you're asking several questions here, I will try and answer the most fundamental one: loading your CSV data into Python and then plotting a basic surface plot.
Note that in the general case you need an NxN matrix of Z values for a plot where X and Y are vectors of length N. This makes sense because every (x, y) point needs a Z value and there are N x N (x, y) points. I will show you two ways. Once you have those then at least you are in a good position to start customizing your plot using documentation and other examples found on the web.
This answer assumes you are using Python 3 and a recent version of Matplotlib and Numpy. (Numpy is a numerical Python package that is commonly included in Python distributions, e.g. Anaconda.) However, syntax should be not be very different in older versions.
First, make the necessary imports:
import numpy as np
import matplotlib.pyplot as plt
from mpl_toolkits.mplot3d import Axes3D
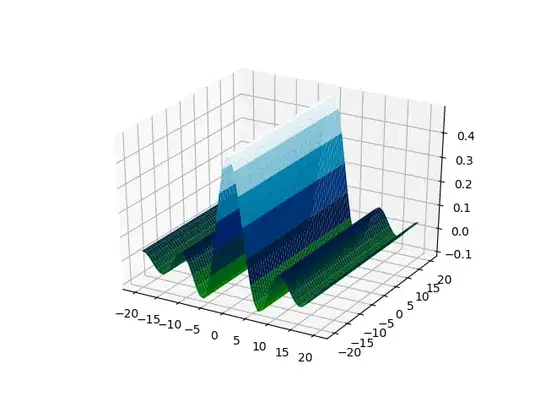
For the case when you have 3 columns of 1d data --- x, y and z:
DataAll1D = np.loadtxt("datacsv_1d.csv", delimiter=",")

# create 2d x,y grid (both X and Y will be 2d)
X, Y = np.meshgrid(DataAll1D[:,0], DataAll1D[:,1])

# repeat Z to make it a 2d grid
Z = np.tile(DataAll1D[:,2], (len(DataAll1D[:,2]), 1))

fig = plt.figure()
ax = fig.add_subplot(111, projection='3d')

ax.plot_surface(X, Y, Z, cmap='ocean')

plt.show()
Note than in np.loadtxt you can set any delimiter, e.g. ' ' for a space.
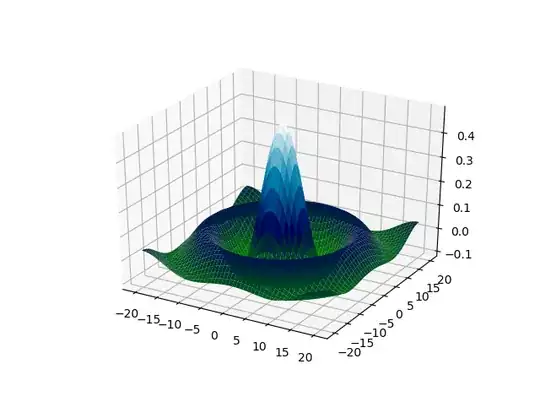
For the case when you have 2 columns of 1d data --- x and y --- and a 2d matrix of z data:
DataX_Y_1D = np.loadtxt("datacsv_1d_xy.csv", delimiter=",")

# create 2d x,y grid (both X and Y will be 2d)
X, Y = np.meshgrid(DataX_Y_1D[:,0], DataX_Y_1D[:,1])

# get 2D z data
Z = np.loadtxt("datacsv_2d_Z.csv", delimiter=",")

fig = plt.figure()
ax = fig.add_subplot(111, projection='3d')

ax.plot_surface(X, Y, Z, cmap='ocean')

plt.show()
For more advanced customization, here's a link to another good tutorial on the subject:
https://jakevdp.github.io/PythonDataScienceHandbook/04.12-three-dimensional-plotting.html
Edit: For the case where you have all the necessary data points covered in 3 columns (X, Y, Z) then plot_trisurf is what you need. See my answer on Stack Overflow for a simple example: https://stackoverflow.com/questions/39240327/3d-surface-plot-using-matplotlib-in-python/52630484#52630484

