I have a booking system for entities (essentially test environments) which has its database. All the bookings made through the front end are stored in the database with attributes - Project/Release name, Start date, End date and Test Phase amongst others.
This database is connected to a Tableau instance.
I am trying to make use of the existing setup to create a plan showing bookings for my entities utilising the Gantt chart feature in Tableau. I have made use of the below link and it worked well for me to this point.
Ref: https://onlinehelp.tableau.com/current/pro/desktop/en-us/buildexamples_gantt.html
My Gantt report looks like this now:

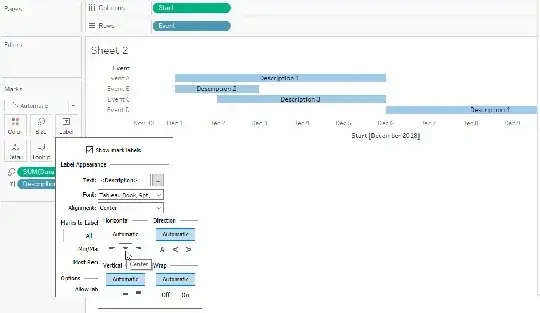
Next thing that I want to achieve is to add some text labels on top of the allocations blocks in this picture and put the "Text" of Project/Release names for each of the allocations.
I am able to do so by dragging the Project/Release names field to the "Label" category under the Marks section. This results in Project/Release names displayed next to the allocation blocks. However, to conserve space and make the plan more presentable, I want these text labels to superimpose on the allocation blocks, not after the end of the allocation blocks. Is there a way in Tableau to make it happen?
Thanks
