I'm creating a report in Power Bi which I re-fresh each month and display data going back two years on a line graph.
Each month the report updates the two year time frame it looks at. For example, Jan 2016 (we call Jan period12) to Dec 2018 (call this period 11).
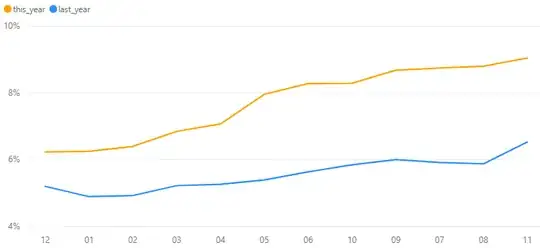
When I display my data, the x axis sorts the value largest to smallest or smallest to largest, rather than by period going 12,1,2,3,4 etc.... Next month the x axis should go 1 to 12. Is there a function in Power Bi to display the data by period please, and to shift each month forward 1 when it re-freshes?
Graph example attached for a bit more clarity on what I am trying to do and shows that the period numbers are in a random order, rather than 12,1,2 etc..