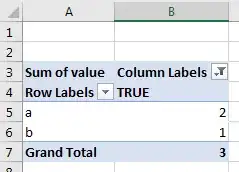
I have some data in Excel 365 for Mac that is formatted like so:
USER    GROUP    IN_SCOPE
1       GroupA   TRUE
2       GroupA   TRUE
3       GroupA   FALSE
4       GroupB   TRUE
5       GroupB   FALSE
I would like to create a pivot table that contains the following:
GROUP   COUNT_IN_SCOPE
GroupA  2
GroupB  1
I believe this should be possible to do within the pivot table itself, but most solutions online seem to point to using Power Query. Unfortunately that's not available for Mac so that's out. I've also tried several calculated fields, including 'IN_SCOPE'*1 and IF('IN_SCOPE', 1, 0) but both return 0 for all rows.
A few notes on the choice of approach: I prefer doing this as a pivot table rather than something else so that I can expand/collapse other meta-categories present in my data. To maintain legibility in the raw data, I would strongly prefer to leave my IN_SCOPE column formatted as Boolean values and I would strongly prefer not to add additional columns.
