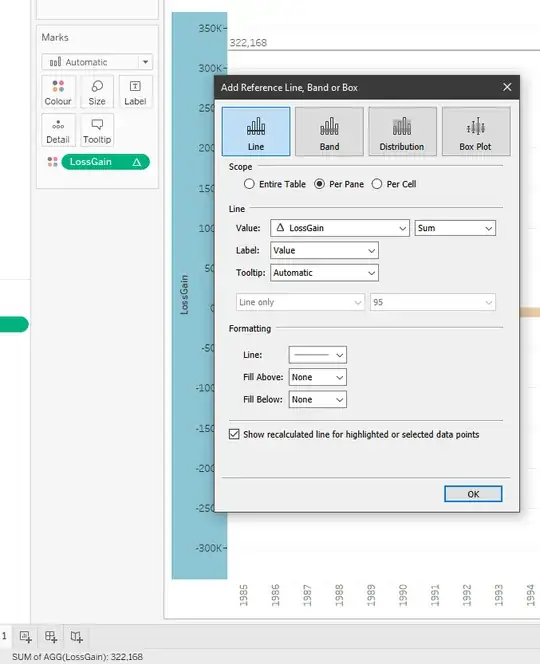
I am working in Tableau to build a dashboard that summarized various measures pertaining the the loss and gain of types of forests. The dashboard shows a bar chart of losses and gains: Losses and Gains chart
The chart was created from a calculation that finds the sum of acres for a year and subtracts the sum of acres from a previous year (there are also additional filters in place for agency, unit, and land type). The calculation used is:
(SUM([Thsnd Acres]))-(LOOKUP(SUM([Thsnd Acres]),-1))
When viewing the chart in the worksheet, at the bottom of the worksheet the SUM of AGG(LossGain): 47.8 is displayed like this: Image of SUM of AGG(LossGain)
I am trying to figure out a way of adding that summed information to the dashboard. When I try to create additional SUM calculations, I am getting errors that indicate I cannot sum an existing aggregation. Because the information is displayed at the bottom of the worksheet, it has to be possible to get that number in a way that it can be inserted into a dashboard.
If anyone can point me in the right direction, it would be much appreciated. It seems like this should be a fairly simple thing to do, but I am stuck.
