1

I'm sorting two columns of numbers. One is a series of spools of wire, and another is a series of needed lengths. I want to optimize the selection of spools for the needed lengths, while flagging spools that are greater than +/- 10% different for return. The -10% accounts for 10% overage in the "needed length" column.

In other words, I want to optimize this list to pair numbers in "original Length," which is what I have in stock, to numbers in "Revised Length," which are the needed lengths, in order to minimize the differences between them, and then flag differences that are out of the 10% range. I also need to keep track of the Reel # in order to flag spools for return.

Any ideas on how to efficiently accomplish this?

Here's an example of the data I'm working with:
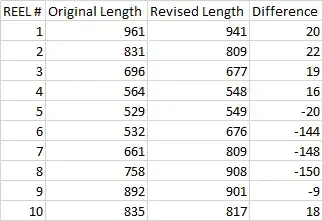
Wire Length Table

enter image description here

Akina
  • 3,295
Matt
  • 11
  • 2

2 Answers2

0

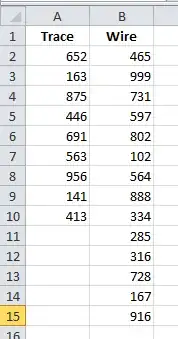
We have 2 columns of lengths in columns A and B on the worksheet with the name "Sheet1" (this is random-generated values in the ranges from 100 to 1000).

enter image description here

We open VBA editor (Alt-F11) and add common module (Insert - Module). Into this module we insert the below code:

Sub SetPairs()
Dim sh As Worksheet
Dim i As Integer, len1 As Integer, len2 As Integer
Const Difference As Single = 0.1 ' 10% '

Set sh = ThisWorkbook.Worksheets("Sheet1")
With sh.Sort
    .SortFields.Clear
    .SortFields.Add Key:=Range("A1"), SortOn:=xlSortOnValues, Order:=xlAscending, DataOption:=xlSortTextAsNumbers
    .SetRange Range("A:A")
    .Header = xlYes
    .MatchCase = False
    .Orientation = xlTopToBottom
    .SortMethod = xlPinYin
    .Apply
    .SortFields.Clear
    .SortFields.Add Key:=Range("B1"), SortOn:=xlSortOnValues, Order:=xlAscending, DataOption:=xlSortTextAsNumbers
    .SetRange Range("B:B")
    .Apply
End With
i = 2
Do
    len1 = sh.Cells(i, 1).Value
    len2 = sh.Cells(i, 2).Value
    If 1# * len1 * len2 = 0 Then Exit Do
    If Abs(len1 - len2) / (len1 + len2) > Difference / 2 Then
        If len1 > len2 Then
            Cells(i, 1).Insert xlShiftDown
        Else
            Cells(i, 2).Insert xlShiftDown
        End If
    End If
    i = i + 1
Loop
End Sub

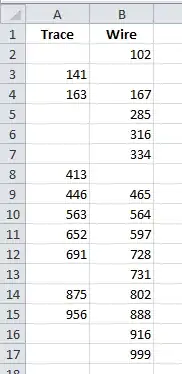
Then we execute this code and obtain the next result:

enter image description here

The pairs which differs less than 10% are posessed in the same row, the values which have no matched paired value stays alone.

PS. 10% is approximate - I use the formula (abs of difference is less then 5% of sum). You may alter it freely.

Akina
  • 3,295
0

Not sure exactly what you want.

But perhaps:

  • Sort the Original along with the REEL #
  • Sort the Revised
  • Compute the %Diff
  • Flag those outside of +/- 10% length diff

If so, you can do this with formulas if you have O365/Excel with the latest SORT function, along with Conditional Formatting.

If you don't have the SORT function, you can easily set up a Query in Power Query to accomplish the same thing, or even do it manually with the Data Sort option in Excel.

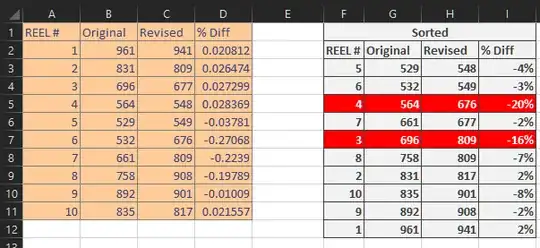
See below:

F3: =SORT(A2:B11,2)
H3: =SORT(C2:C11)
I3: =1-(H3/G3) (and fill down)

Then select the resulting table data F3:I12

Conditional format with a formula: =ABS($I3) > 0.1

enter image description here

NOTE:

  • This method will not provide optimal answers
    • If there are different numbers of desired lengths than actual lengths
    • It you might want to combine several desired lengths to "add-up" to a single reel length.

If you need to truly optimize, you will need a VBA solution.