How do I get the forecast to not show the flat line in the past and also the actual to now show the flat line in the future?
How do I get the forecast to not show the flat line in the past and also the actual to now show the flat line in the future?
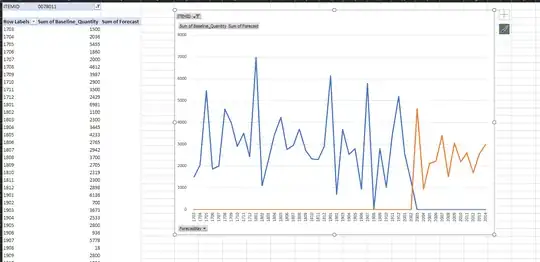
I test on Office 365, to hide the line in Pivot Chart for blanks, please right click the Pivot Chart > Select Data > Hidden and Empty Cells > Gaps > OK > OK.
The following picture shows the display of Pivot Chart for my sample.
