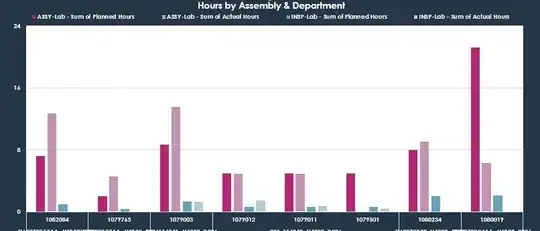
I have a non-stacked pivot bar chart that is showing two values (Sum of Planned Hours & Sum of Actual Hours) for a number of Series.
What I want to achieve is a formatting rule that if all the bars for Planned Hours for each series are shown in solid, and all the bars for Actual Hours are shown in hashed lines.
This chart will be regularly updated with different series e.g. Assy, Insp, Plan but I want the formatting to remain based on the values planned & actual. Potentially I could run a macro after each chart update?
I've included a picture of the desired format with two series included as an example, linked below.
Any/all help would be much appreciated!
Example Chart:
