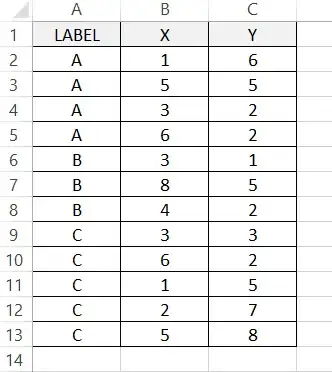
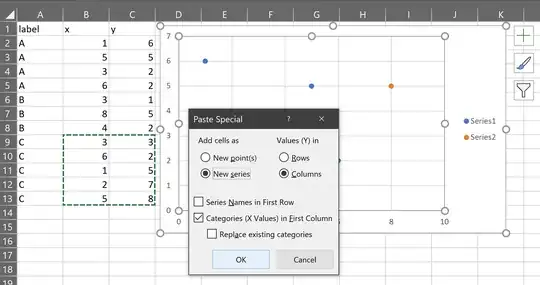
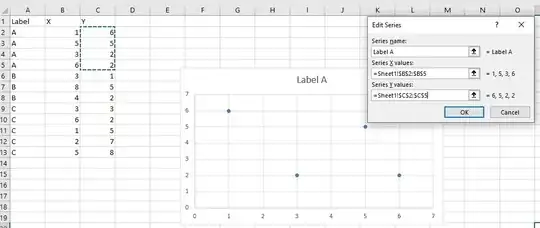
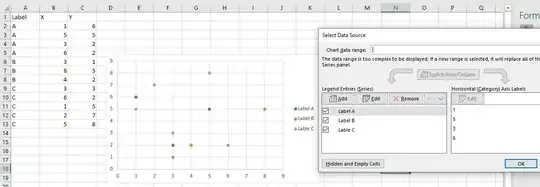
I have a table of information in excel in which I have a column for some attribute and two columns of for example X and Y information. I want to plot them in scatter form but with specified color for each attribute. I want to know how to do this in excel. My table is something like the following:
I want to have for all points with label "A", color A, for all points with label "B", color B and for label "C", color C for example.
How can I do this automatically? My data set and number of labels are so much!


