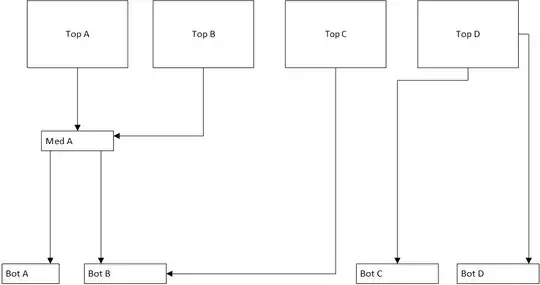
Looking for help/any advice importing a very large many-to-many entity relationship diagram from data in Excel into a relationship diagram in Visio.
My data is identifying upstream & downstream dependency relationships of the entities and I'm looking for a way to visualize this in an easy way from data extracts. Organization hierarchy imports fail as it's possible for my top level data to rely on more than one underlying upstream dataset. One top-level dataset can have multiple underlying dependencies on mid/low-level datasets, and those mid/low-level datasets can sometimes be summarized into other top-level datasets.
An example would include data structured like this
I had found an article doing essentially what I'm trying to do back from Visio 2002 but I can't seem to find if the functionality is still supported: https://boxesandarrows.com/automating-diagrams-with-visio/
The article describes a CSV file formatted as such to create the shapes with numbering schemas to uniquely identify shapes:
Shape,"1.0","","Top A"
Shape,"1.1","","Top B"
Shape,"1.2","","Top C"
Shape,"1.3","","Top D"
Shape,"2.0","","Med A"
Shape,"3.0","","Bot A"
Shape,"3.1","","Bot B"
Shape,"3.2","","Bot C"
Shape,"3.3","","Bot D"
And then appended rows like so to create the links between the shapes using their unique numbering schemas:
Link,"","","","1.0","2.0"
Link,"","","","1.1","2.0"
Link,"","","","2.0","3.0"
Link,"","","","2.0","3.1"
Link,"","","","1.2","3.1"
Link,"","","","1.3","3.2"
Link,"","","","1.3","3.3"
Visio 2016 (even professional version) doesn't appear to have an easy way to handle data like this. Appreciate any input on how I can get this data in a visual format to better explain some of these relationships.