Before I added a replacement drive to an array, I executed this script to make sure I didn't need to send the replacement back to the manufacturer:
date
badblocks -b 4096 -c 4096 /dev/sdd
date
hdparm -Tt /dev/sdd
date
Its execution produced this output about 8 hours later letting me know I could keep the drive:
Thu Jan 28 20:07:54 CST 2021
Fri Jan 29 04:37:40 CST 2021
/dev/sdd:
 Timing cached reads:   34840 MB in  1.99 seconds = 17546.64 MB/sec
 Timing buffered disk reads: 728 MB in  3.01 seconds = 242.16 MB/sec
Fri Jan 29 04:37:40 CST 2021
While badblocks was running, about once per hour I executed strace to see how it was doing. Each time I executed it, I noticed the frequency of system calls was decreasing. And each time I executed it I saw this pattern, which assured me it was making progress (i.e., the seek values were increasing by 16M, the size of the read calls):
lseek(3, 5929403678720, SEEK_SET)  = 5929403678720
read(3, "\0\0\0"..., 16777216)     = 16777216
lseek(3, 5929420455936, SEEK_SET)  = 5929420455936
read(3, "\0\0\0"..., 16777216)     = 16777216
I looked at top. At the top was badblocks, taking about 3% of a core and no other process was doing anything on this private machine. After reading this, I decided to read the source code (specifically the test_ro function). Not seeing any problem, I'm asking:
- What could be the source of the ramp? A ramp is where every loop's iteration is slower than its prior iteration.
- Can I work around it only by restarting
badblocksat the last known offset? - Will bad blocks be displayed only at the end of the execution or as soon as they are encountered? The man page doesn't make that clear.
I'm using e2fsprogs Version: 1.42.13-1ubuntu1.2, which is the package containing badblocks.
Update 1
Because I had to replace two drives, I decided to collect more information. I first wanted to make sure strace would report on sleep calls so I traced an execution of this:
#include <stdio.h>
#include <unistd.h>
#include <time.h>
int main (int argc, char *argv[]) {
   sleep(3);
   usleep(5123456);
   struct timespec req = {7,123456789};
   struct timespec rem = {0,0};
   nanosleep(&req, &rem);
}
And I saw this, which proves to me that the ramp is not caused by test_ro executing sleep calls (because some executions of badblocks can include sleep calls but at no time did I see any evidence of badblocks executing them):
nanosleep({3, 0}, 0x7ffff1cbaa60)       = 0
nanosleep({5, 123456000}, NULL)         = 0
nanosleep({7, 123456789}, 0x7ffff1cbaab0) = 0
Here is the modified script that automates the periodic collection of system call counts:
date
badblocks -b 4096 -c 4096 $dev -o bad.out &
bp=$!
while [ -e /proc/$bp ]; do
    date
    strace -c -p $bp &
    sp=$!
    sleep 5
    kill $sp
    sleep 300
done
date
echo waiting
wait
date
hdparm -Tt $dev
date
And I executed the script with nohup sh check >check.out 2>&1 &.
Here are lines 1-11 of check.out:
nohup: ignoring input
Fri Jan 29 17:57:35 CST 2021
Fri Jan 29 17:57:35 CST 2021
strace: Process 3404 attached
strace: Process 3404 detached
% time     seconds  usecs/call     calls    errors syscall
------ ----------- ----------- --------- --------- ----------------
 99.84    0.156000        2137        73           read
  0.16    0.000248           3        74           lseek
------ ----------- ----------- --------- --------- ----------------
100.00    0.156248                   147           total
And here are lines, 903-919, from the same file:
Sat Jan 30 02:25:55 CST 2021
strace: Process 3404 attached
strace: Process 3404 detached
% time     seconds  usecs/call     calls    errors syscall
------ ----------- ----------- --------- --------- ----------------
100.00    0.072000        2118        34           read
  0.00    0.000000           0        35           lseek
------ ----------- ----------- --------- --------- ----------------
100.00    0.072000                    69           total
Sat Jan 30 02:31:00 CST 2021
waiting
Sat Jan 30 02:31:00 CST 2021
/dev/sdd:
 Timing cached reads:   34034 MB in  1.99 seconds = 17137.69 MB/sec
 Timing buffered disk reads: 730 MB in  3.00 seconds = 242.94 MB/sec
Sat Jan 30 02:31:13 CST 2021
Of course, bad.out was empty.
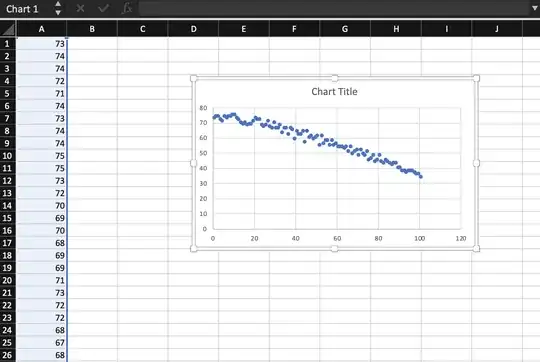
I filtered the 101 read counts with grep read\$ check.out| awk '{print $4}'.
And then I pasted the read counts into Excel to produce this scatter plot:
Update 2
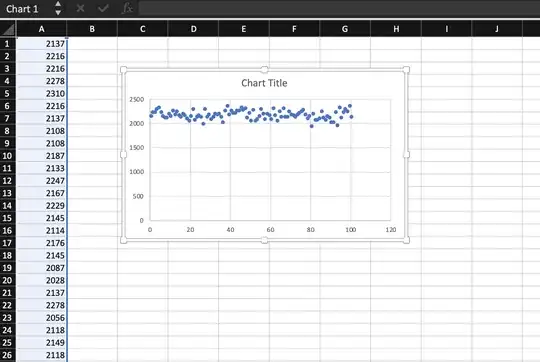
Then I plotted the strace output for usecs/call using grep read\$ check.out| awk '{print $3}':
However, strace does not print maximum and minimum durations (although it could). The fact that the count is lower but average duration is not lower must mean that the durations are indeed increasing. Sounds like a clue to me.
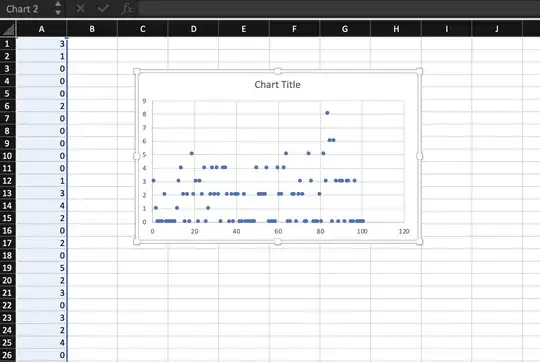
Then I displayed the distinct lseek durations:
# grep lseek\$ check.out| awk '{print $3}' | sort | uniq -c
     44 0
      3 1
     24 2
     13 3
     10 4
      4 5
      2 6
      1 8
These lseek durations I expected because the seek is not moving the head because the code is seeking to the same place left by the read.
Just for completeness, here's their scatter plot (zeros throughout), created from grep lseek\$ check.out| awk '{print $3}':


