3

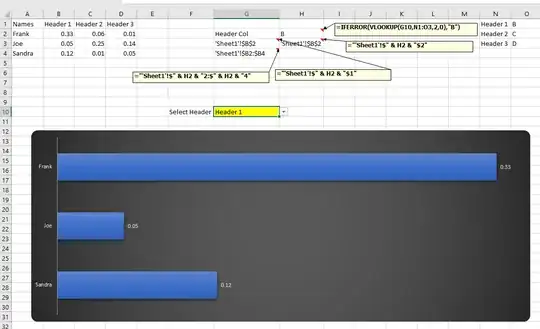
I am trying to create a dynamic chart but the data labels are missing. I add the data labels manually to all headers and then save and close the file. When I open the file and select a different header, they go missing again. Only the chart with the active "header" retains the data label. How do I solve this issue?

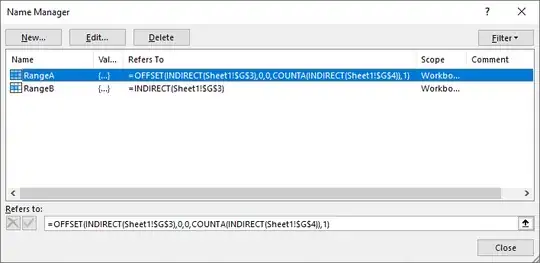
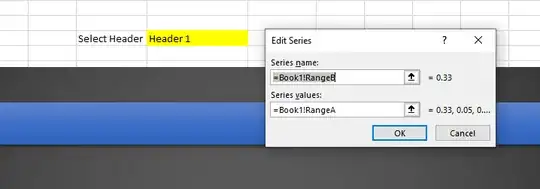
This is how my data, named ranges and chart connection looks like

Data

Data

Named ranges

Named ranges

Chart connections

Chart connections

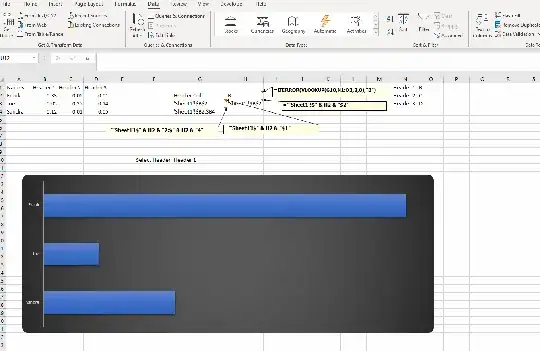
Output

Output

Greenonline
  • 2,390
Dhruva
  • 435

1 Answers1

6

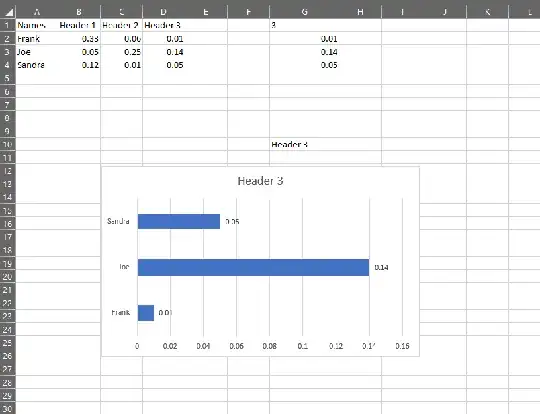
The chart is treating the three columns as different series.

Use a formula to copy the data for the selected column into a single column that doesn't change. I have put this formula in G1:

=RIGHT($G$10,1)

And this formula in G2:

=OFFSET(A2:A4,0,G1)

I have list data validation in cell G10, similar to you:

enter image description here

Here, the chart is always using the same range for the data, so it treats it as a single series. As you have added the labels to that series, they are not lost when the data changes.

FlexYourData
  • 7,631