pretty new in excel and I'm currently working on a pivot table and want to create a bar chart.
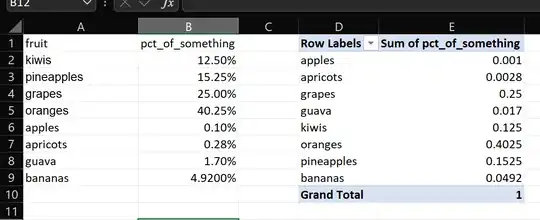
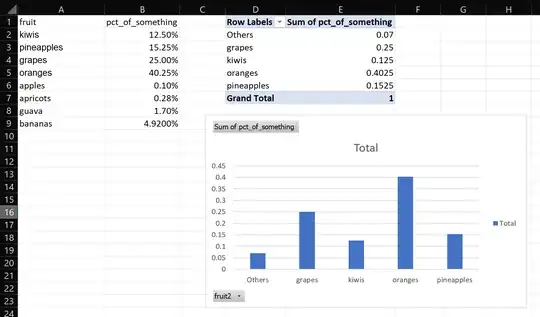
I have around 15 row labels and 2 columns- row labels and percentages that looks something like this:
apples     0.1%
apricots   0.28%
guava      1.7%
.
.
.
.
oranges    40.25%
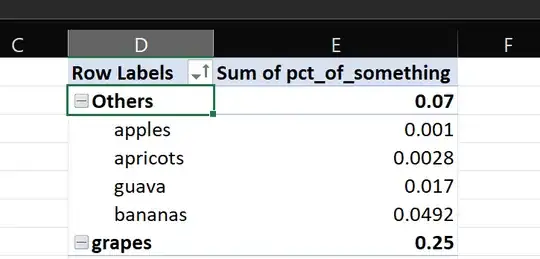
When I create a bar chart, it looks too much having too many on the y axis, so I want to create a label "Others" that is basically the sum of specific rows of the percentages in this case when the value is too small.
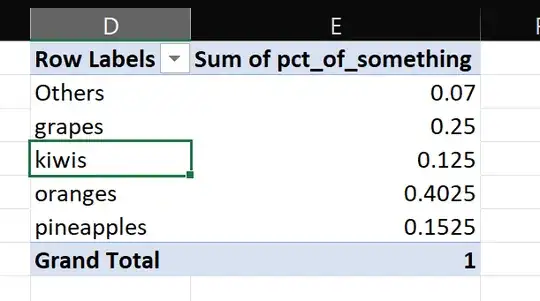
So I want it to look like
others        7.00%
kiwis        12.50%
pineapples   15.25%
grapes       25.00%
oranges      40.25%
