1

I have a table of roads by year.

The NEXT_ACTIVITY column categorizes the roads by the theoretical maintenance activity that the roads fall into.

    YEAR  COUNT/TOTAL   ROAD_COUNT    NEXT_ACTIVITY
    ----  ----------   -----------    ------------------
    2013      77.43%         1185     None/Good
    2013      17.05%          261     Overlay
    2013       2.16%           33     Full Depth Removal
    2013       3.36%           51     Reconstruction
2014      73.84%         1130     None/Good
2014      20.54%          314     Overlay
2014       2.38%           36     Full Depth Removal
2014       3.23%           49     Reconstruction

2015      64.21%          983     None/Good
2015      28.80%          441     Overlay
2015       3.69%           56     Full Depth Removal
2015       3.30%           50     Reconstruction

2016      65.06%          997     None/Good
2016      28.58%          438     Overlay
2016       3.62%           55     Full Depth Removal
2016       2.74%           42     Reconstruction

2017      63.71%          977     None/Good
2017      29.67%          455     Overlay
2017       4.01%           61     Full Depth Removal
2017       2.61%           40     Reconstruction

2018      62.19%          954     None/Good
2018      30.15%          462     Overlay
2018       4.92%           75     Full Depth Removal
2018       2.74%           42     Reconstruction

2019      61.51%          943     None/Good
2019      29.82%          457     Overlay
2019       5.93%           91     Full Depth Removal
2019       2.74%           42     Reconstruction

2020      60.27%          924     None/Good
2020      30.54%          468     Overlay
2020       6.62%          101     Full Depth Removal
2020       2.57%           39     Reconstruction

2021      58.31%          894     None/Good
2021      30.87%          473     Overlay
2021       7.86%          120     Full Depth Removal
2021       2.97%           45     Reconstruction

2022      58.31%          894     None/Good
2022      30.87%          473     Overlay
2022       7.86%          120     Full Depth Removal
2022       2.97%           45     Reconstruction


In Excel 2016, I want to graph the data in a stacked bar chart.

  • YEAR as the X-axis
  • COUNT/TOTAL (percentage) as the Y-axis
  • Each bar (year) would be composed of four categories (sub-bars):
    • None/Good
    • Overlay
    • Full Depth Removal
    • Reconstruction

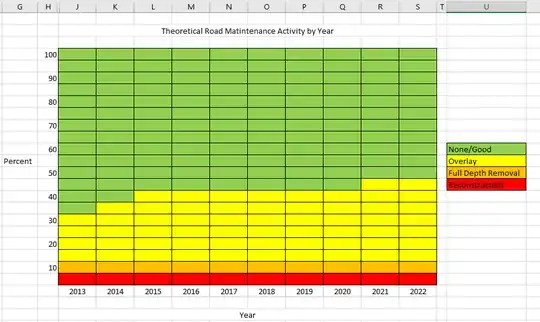
I think it would look something like this (not totally accurate):

enter image description here


Question:

How can I make a stacked bar chart like that in Excel 2016?
User1974
  • 185

1 Answers1

2

You just need to modify how your data appear and then you can create the stacked bar chart from your modified data. You can keep your original data as-is, but then use another sheet to get the proper format for your chart.

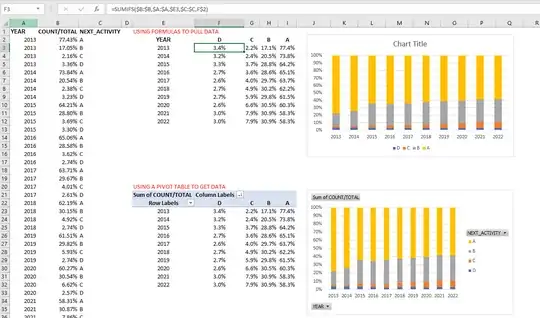
Easiest Solution: Create a pivot table on your data. Then create the chart from the pivot table. Just select your data and insert pivot table. Rows is Year, Columns is Next Activity, and Values is Count/Total column.

More cumbersome but viable solution: Use formulas to get your data. See below...

Column E: Distinct Year

Cells F1:I1: Your Four categories as they appear in Column C. You'll use a formula to populate the data below it.

Cell F2 formula: =SUMIFS($B:$B,$A:$A,$E2,$C:$C,F$1)

With those locked references, you can drag it across and down then generate your chart from this array.

enter image description here

IMHO, use a Pivot table. It's super quick and you can adjust the design of the chart to remove the buttons, etc. You just need to refresh the pivot when new data are added. Also, convert your data into a Table. That way you don't need to modify the selected area when updating your pivot.

Isolated
  • 1,535
  • 1
  • 5
  • 6