0

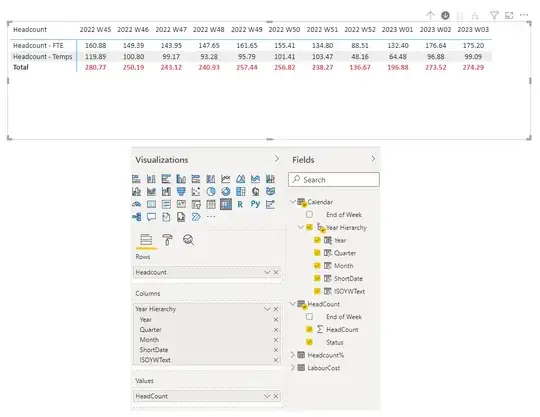
I have a Power BI Matrix visual as shown below.
At the moment it is showing the ISO Week Number. You can drill down to see the week ending date (not really a drill-down as it's the same level), then the monthly figure, quarterly figure and finally the annual figure.

enter image description here

The data table for the visual is below.
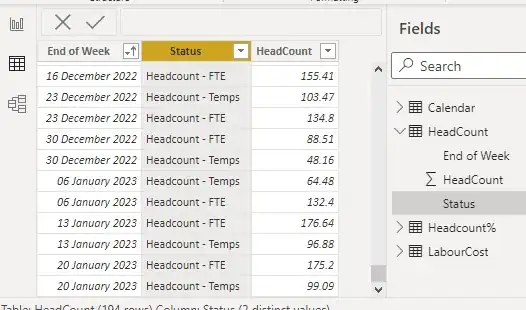
enter image description here

I also have a version of the table (not connected to the visual) that is below - if it makes life easier.
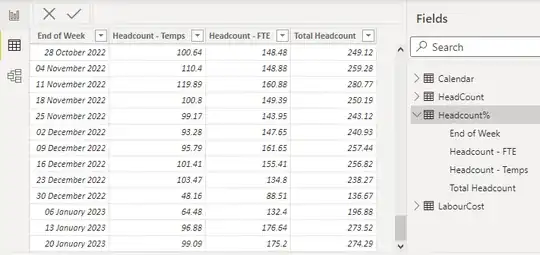
enter image description here

Question:

I am trying to add a DAX formula to calculate the % of Temps over the total displayed (i.e taking into the account the drill-down level).
My DAX knowledge at the moment is I know there's a lot I don't know.... like most of it.

I thought I was onto something with ALLSELECTED, but can't figure out how to get it to sum everything - don't even know if that would be the correct starting point.
Temp % = DIVIDE([HeadCount],CALCULATE(ALLSELECTED(HeadCount[HeadCount]))) - which is, as I thought it would, returning an error.

Thanks in advance for any help you can offer.
1 Answers1

0

After sleeping on it for a weekend I've come up with this formula which gives me the Temp % and updates as I drill-down.

Temp % = DIVIDE(CALCULATE(SUM(HeadCount[HeadCount]), FILTER(HeadCount,HeadCount[Status]="Headcount - Temps")), CALCULATE(SUM(HeadCount[HeadCount]),ALL(HeadCount[Status])))

Unfortunately I can't get it as a third row on the Matrix table, only as a column next to the original HeadCount column - this then leaves the Perm (FTE) row blank as far as percentages go. I've had a look around the internet and it seems that this isn't easily possible at the moment. I'm on Version: 2.99.621.0 64-bit (November 2021), so will harass IT to update me - might be something in the newer versions.

So I've updated the formula to:

% = DIVIDE(SUM(HeadCount[HeadCount]), CALCULATE(SUM(HeadCount[HeadCount]),ALL(HeadCount[Status])))  

This calculates both the Temp & Perm (FTE) percentages