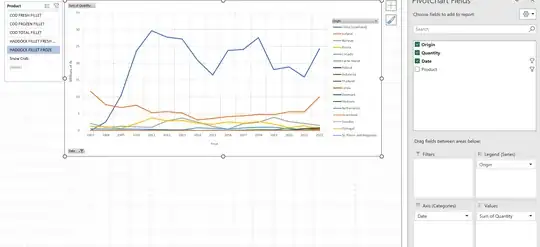
I have a graph which many Series, but I only need the first 5 and I want to group up the rest as a Series of its own called "others".
Here you can see how all the smaller data below the top 6 agglomerate with each other.
On the Pivot table I tried by selecting the smaller data and using the "group" option, but when using that option it is not grouped the way I want, some of the columns were duplicated in both groups. I also tried to use the "Value Filters" option and group in top 5, but that way only eliminates the other series.
This is my pivot table, and the data I want to group all the columns outside the top 5 ex. (Faroe Islands to Ireland):
This is the result of when IM trying to group selecting the data outside of the top 5 (Faroe Islands to Ireland) and using the "group" option:


