1

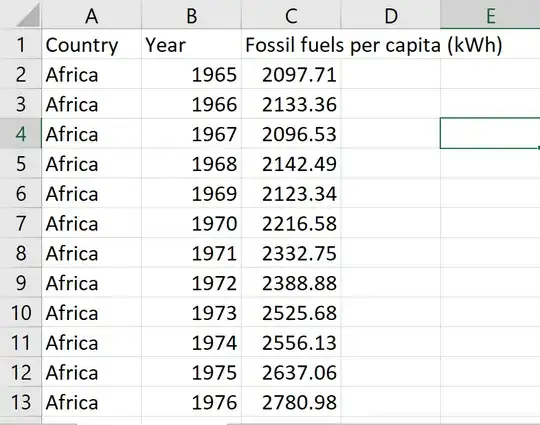
I have an excel sheet with three columns: Country, Year and Fuel consumption per capita.

Dataset:

Dataset

The country column has data for all worldwide countries. The year range for each country is from 1965 to 2021. I'm trying to transpose the data in such a way that there's just one row for each country and a separate column for every year and its associated fuel consumption. Could anyone please help me with that?

Expected result:
Expected result

Greenonline
  • 2,390
Nitinn
  • 13
  • 2

1 Answers1

1

I recommand you to do Insert / Table on your dataset. Then your dataset will have a name, and if you add data, the name will cover the extra data. (The table coverage is shown by half the lines colored).

Then Insert / Pivot Table. On the right, you have the different fields you can drag on drop below (Country on rows, year on columns, Fossil fuel on value).