I'm investigating a performance issue on my Ubuntu 22.04.2 LTS machine. I take the following steps:
sudo perf record -g -F max -s --call-graph dwarf -e cycles -e sched:sched_switch --switch-events --sample-cpu
Then open the recording with sudo hotspot:
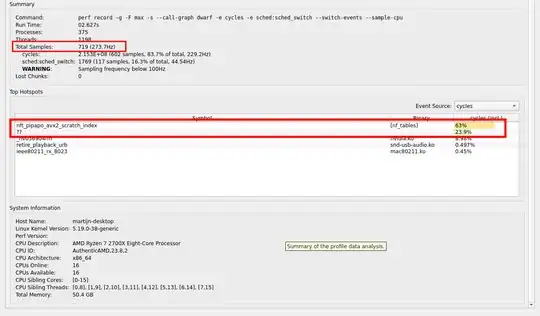
I realize that probably this is not very accurate of a measurement, because it collected only 719 samples over 2 seconds. However...
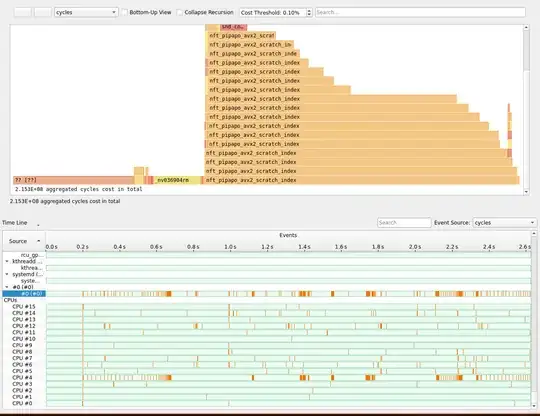
The timeline suggests that the CPU was spending quite some time in process #0, which is the kernel I assume.
When looking at the Top Down view in HotSpot, we can see that this nft_pipapo_avx2_scratch_index pops in pretty much everywhere.
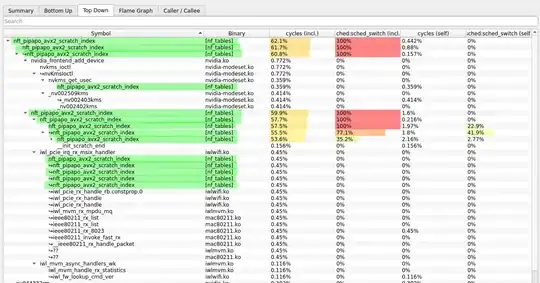
Reading about what this thing is, it seems to be part of the netfilter project nf_tables:
/* PIPAPO: PIle PAcket POlicies: set for arbitrary concatenations of ranges
Defined here: https://elixir.bootlin.com/linux/latest/source/net/netfilter/nft_set_pipapo_avx2.c#L75
This seems to be a kernel module to deal with filtering IP packets and doing firewall stuff.
This doesn't seem all that bad, but when I run my own high-performance software package (same perf command, but adding my binary in the end) I get this in the latest version of HotSpot:
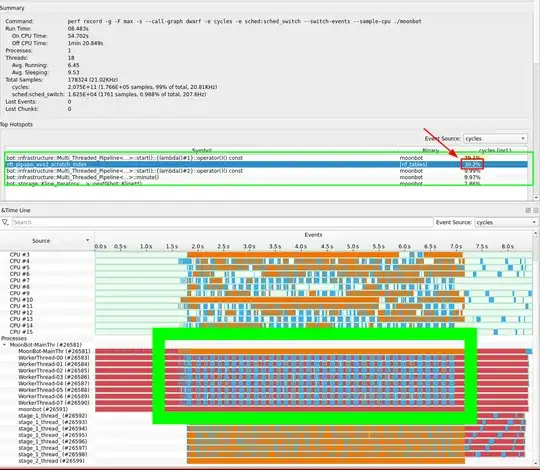
Now HotSpot claims that 30% of the "cycles" correspond to this mysterious function. All the blue in the timeline suggests that the function is indeed everywhere intervening across all my threads.
Now, as it still suggests, this happens in a binary called nf_tables. The funny thing is: I recorded this after having blacklisted the kernel modules nf_tables, x_tables and ip_tables. I confirmed this after rebooting that no such kernel modules were present when querying lsmod.
It gets extra difficult when I try to open the same perf recording in perf-report. I never get to even see it. This makes me believe I actually am missing some flags for perf report to tell it to also show those. By now, I have installed the linux kernel image with debug symbols and pointed perf to this using -k, but that doesn't make a difference. Anyway: how would HotSpot be able to show them without ever having those kernel debug symbols?
I currently have two hypothesis:
- Hypothesis 1)
perf reportdoesn't show those samples, because it filters based on the binary I profiled. - Hypothesis 2) This is a visualization bug in how HotSpot attributes cycles/time to recorded samples.
