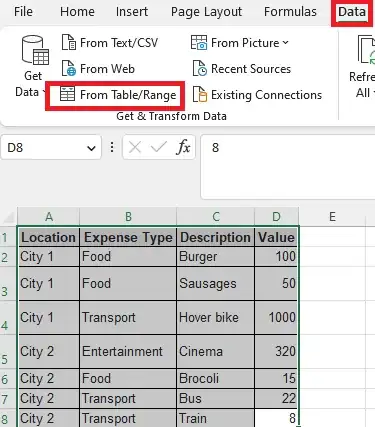
I have a table where I have various costs that have been grouped can captured by row.
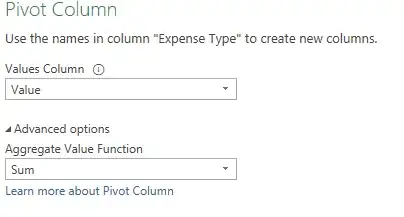
In the rows structure in the first row is the value I want to remain as a row, the second column has the transformed column name and the third row the value to sum.
This is a little like this question Excel: How to extract group of the same rows and their values into columns? but I want to include sums and power query would provide a suitable answer.
Prior to transform
| Location | Expense Type | Description | Value |
|---|---|---|---|
| City 1 | Food | Burger | 100 |
| City 1 | Food | Sausages | 50 |
| City 1 | Transport | Hover bike | 1000 |
| City 2 | Entertainment | Cinema | 320 |
| City 2 | Food | Brocoli | 15 |
| City 2 | Transport | Bus | 22 |
| City 2 | Transport | Train | 8 |
After Transform
| Location | Food | Transport | Entertainment |
|---|---|---|---|
| City 1 | 150 | 1000 | 0 |
| City 2 | 15 | 30 | 320 |
Looking for the optimum way to do this, ideally it would handle additional entries without having to adjust the formula this will drive a subsequent vlookup.


