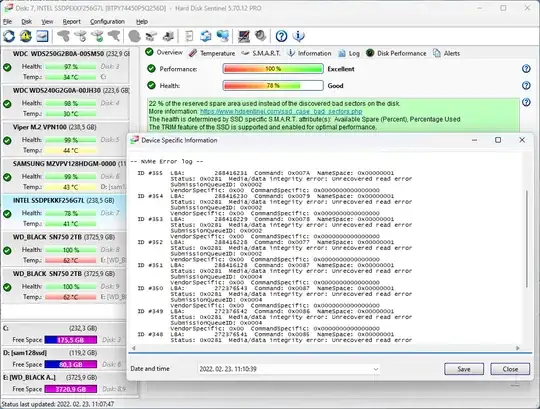
smartd(8) on my laptop alerted me about increase in “number of Error Log entries” on /dev/nvme0 for about 8 each day.
The output of smartctl -a /dev/nvme0 looks as follows:
smartctl 7.2 2020-12-30 r5155 [x86_64-linux-6.4.0-060400rc4-generic] (local build)
Copyright (C) 2002-20, Bruce Allen, Christian Franke, www.smartmontools.org
=== START OF INFORMATION SECTION ===
Model Number:                       SAMSUNG MZVLB1T0HBLR-000L2
Serial Number:                      S4DZNX0R997671
Firmware Version:                   3L1QEXF7
PCI Vendor/Subsystem ID:            0x144d
IEEE OUI Identifier:                0x002538
Total NVM Capacity:                 1,024,209,543,168 [1.02 TB]
Unallocated NVM Capacity:           0
Controller ID:                      4
NVMe Version:                       1.3
Number of Namespaces:               1
Namespace 1 Size/Capacity:          1,024,209,543,168 [1.02 TB]
Namespace 1 Utilization:            207,072,522,240 [207 GB]
Namespace 1 Formatted LBA Size:     512
Namespace 1 IEEE EUI-64:            002538 8911b6e186
Local Time is:                      Thu Jun 15 10:12:23 2023 MSK
Firmware Updates (0x16):            3 Slots, no Reset required
Optional Admin Commands (0x0017):   Security Format Frmw_DL Self_Test
Optional NVM Commands (0x005f):     Comp Wr_Unc DS_Mngmt Wr_Zero Sav/Sel_Feat Timestmp
Log Page Attributes (0x03):         S/H_per_NS Cmd_Eff_Lg
Maximum Data Transfer Size:         512 Pages
Warning  Comp. Temp. Threshold:     84 Celsius
Critical Comp. Temp. Threshold:     85 Celsius
Supported Power States
St Op     Max   Active     Idle   RL RT WL WT  Ent_Lat  Ex_Lat
 0 +     8.00W       -        -    0  0  0  0        0       0
 1 +     6.30W       -        -    1  1  1  1        0       0
 2 +     3.50W       -        -    2  2  2  2        0       0
 3 -   0.0760W       -        -    3  3  3  3      210    1200
 4 -   0.0050W       -        -    4  4  4  4     2000    8000
Supported LBA Sizes (NSID 0x1)
Id Fmt  Data  Metadt  Rel_Perf
 0 +     512       0         0
=== START OF SMART DATA SECTION ===
SMART overall-health self-assessment test result: PASSED
SMART/Health Information (NVMe Log 0x02)
Critical Warning:                   0x00
Temperature:                        50 Celsius
Available Spare:                    100%
Available Spare Threshold:          10%
Percentage Used:                    0%
Data Units Read:                    57,117,910 [29.2 TB]
Data Units Written:                 4,531,539 [2.32 TB]
Host Read Commands:                 754,410,384
Host Write Commands:                127,604,849
Controller Busy Time:               1,014
Power Cycles:                       1,123
Power On Hours:                     450
Unsafe Shutdowns:                   139
Media and Data Integrity Errors:    0
Error Information Log Entries:      1,236
Warning  Comp. Temperature Time:    0
Critical Comp. Temperature Time:    0
Temperature Sensor 1:               50 Celsius
Temperature Sensor 2:               47 Celsius
Thermal Temp. 1 Transition Count:   27
Thermal Temp. 1 Total Time:         1121
Error Information (NVMe Log 0x01, 16 of 64 entries)
Num   ErrCount  SQId   CmdId  Status  PELoc          LBA  NSID    VS
  0       1236     0  0x8009  0x4004      -            0     0     -
Ī̲ found no additional alerts (along the lines of that post or similar means) in the system logs; particularly, no visible writing (or reading) errors etc. But this annoyance is not very usual because the laptop works since April, 2022 whereas the number of errors increased from 988 to 1236 during the last 30 days.
Given that the SSD stores some valuable data, have Ī̲ any serious pretext for concern? If not now, then which error rate should make me alarmed? This is a Lenovo IdeaPad 5 Pro (see full hardware information there).
