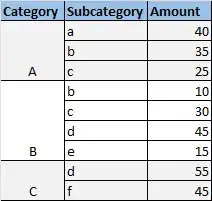
I have the following set of data
I want to create a column chart with 3 stacked columns(one for each category). The sum of amounts for each category equals 100. The issue I'm having is that the subcategories can be different for each category.
Please help me how to create the required chart.

