0

I'm having hard time understanding memory usage reported by top. The memory summary section lists the following. All numbers in MiB.

MiB Mem :  31884.1 total,  13562.7 free,   7881.9 used,  10439.4 buff/cache
MiB Swap:   2048.0 total,   2048.0 free,      0.0 used.  22665.9 avail Mem

However, when I sum up RES column values, they don't add up to used reported in the summary. Summation of RES is 15225.7. This is double used value of 7881.9. If I add used and buff/cache, I get 18321.3. So, now the summation of used and buff/cache is more than summation of RES.

More findings:

  • Noticed that top memory summary almost matches that of free. The following is free -m output.
               total        used        free      shared  buff/cache   available
Mem:           31884        7881       13555         886       10446       22658
Swap:           2047           0        2047

As you can see, used, free, buff/cache, as well as, available all have almost the same values.

  • When I add from free output the fields used, shared, and buff/cache, I get 19213. This is again more than RES summation! This is expected, however, as we agreed that the output of free and top match from summary standpoint.

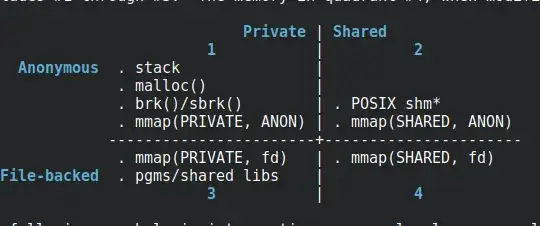
  • I'm expecting that RES summation (from top) would be equal/close to summation of used, shared, and buff/cache (from free) as top documentation lists that memory per process factors in private and shared portions.

quadrants pictorial explanation of memory types

      RES  - anything occupying physical memory which, beginning with
            Linux-4.5, is the sum of the following three fields:
            RSan - quadrant 1 pages, which include any
                   former quadrant 3 pages if modified
            RSfd - quadrant 3 and quadrant 4 pages
            RSsh - quadrant 2 pages
  • Whenever I clear system cache, RES summation always is more than the expected summation. This is how I clear system cache: sudo sync && sudo sysctl -w vm.drop_caches=1. Interestingly enough, RES summation upped to 18175.2! The following is the memory summary of top after clearing the cache. You can notice significant decrease in buff/cache, as expected. However, I wasn't expecting significant increase in used field! Summation of used, shared, and buff/cache from free output is 13533. This is around 5 GiB less than RES summation!
MiB Mem :  31884.1 total,  19358.2 free,   8795.6 used,   3730.2 buff/cache
MiB Swap:   2048.0 total,   2048.0 free,      0.0 used.  21626.5 avail Mem
  • Tried smem and the values don't match either top, free, or summation of RES!

I can't make sense of the numbers! And I don't know, as a application developer (or software engineer), how much memory an application I write actually takes and won't be able to investigate a memory issue if I run into one! I'm totally lost here. If someone can shed some light on what's going on, this will be much appreciated!

I looked at other questions but non actually addresses the inquiry. Like: Why does the memory usage in "top" not add up?. This one was lucky their numbers checked out fine. .. and more, but still didn't find clear cut answer!

Looked at this one too: Why total RES doesn't match used memory in top command? [duplicate] Neither does this one (Correctly determining memory usage in Linux) answer the question.
joker
  • 245

3 Answers3

2

There are very good posts that explain these differences :

There is no point in my repeating the answers in these posts, so I'll just mark up the main points:

Keep in mind that there is a distinction between 'active' and 'consumed' memory. Linux tends to store large volumes of data in memory in case it's needed in the future. But processes may not actively be using this memory - in which case they report a lower volume of 'used' memory.

Should a process suddenly demand more memory, then the kernel will release some of that cached data, and allow the process to use it.

So technically the memory is both 'used' and 'free' at the same time.

I also like using htop instead of top, as it displays these differences.

It's also recommended to use ps_mem :

A utility to accurately report the core memory usage for a program.

harrymc
  • 498,455
0

Not really addressing the confusing/conflicting values from different utilities but you can get the actual memory usage of any given process from /proc/"PID of process"/status. You might also want to look into Valgrind to monitor the application's memory management at runtime.

doneal24
  • 736
0

I found what I believe the answer to the question so I'm posting it here.

The reason RSS processes summation don't add up to used from top is because how top represents a process memory usage.

You see, RSS is the memory used by an application running. Normally, applications rely on shared libraries (to at least perform basic operations) which the OS load into memory once and give access to all application requiring them. top factors in the application memory consumption both: the memory consumed by the application + the shared libraries it requires. Hence, top double-counts memory usage because of the shared libraries. While usage is summation of memory consumed by the applications counting shared libraries consumption once. Thus, RSS summation will always be greater than or equal to used field.

ps_mem and smem tools (you can get them installed on your system) give better memory usage reports. They give for every process the USS and PSS values. USS is the unique memory usage per process, factoring out shared libraries. Think of it as the memory consumed sololey for running that process. It's the amount of memory freed when you kill the process. PSS is USS + the shared libraries consumption divided equally among the sharing processes.

Sample ps_mem output:

 Private  +   Shared  =  RAM used       Program
...
331.6 MiB +  20.2 MiB = 351.9 MiB       /opt/google/chrome/chrome
363.1 MiB +  21.3 MiB = 384.5 MiB       /snap/code/158/usr/share/code/code --no-sandbox --force-user-env
388.4 MiB + 933.5 KiB = 389.4 MiB       /usr/sbin/mysqld
---------------------------------
                          6.5 GiB
=================================

Sample smem output:

  PID User                      Command                                                                                                                                              Swap     USS     PSS     RSS
...
 6840 ahmad.elkomey             /opt/google/chrome/chrome                                                                                                                               0  332.5M  352.6M  482.4M
 7223 ahmad.elkomey             /snap/code/158/usr/share/code/code --no-sandbox --force-user-env                                                                                        0  363.1M  384.3M  460.0M
 1952 mysql                     /usr/sbin/mysqld                                                                                                                                        0  388.4M  389.3M  398.3M
------------------------------------------------------------------------------------------------------------------------------------------------------------------------------------------------------------------
  236 17                                                                                                                                                                                0    5.5G    6.5G   12.1G

General Observations:

  • When you run ps_mem and smem with sudo, summation of PSS of smem is equal to that of ps_mem's.
  • When you run ps_mem and smem with sudo, summation of RSS of smem is equal to summation of RSS of top.
  • When you run smem without sudo, PSS summation = used from top. Using sudo enables fetching more processes running by other users (or privileged processes). RSS summation from smem won't match then that of top's.

Hint: I installed ps_mem with pip for the current user only --user. However, in order to run it with sudo, this is the command I ran:

sudo PATH="${PATH}" PYTHONPATH="${HOME}/.local/lib/python3.10/site-packages" -s ps_mem
joker
  • 245