I was able to work with a template that more or less accomplishes what I'm looking for, however I've hit a wall.
Specifically, the maximum vertical height of the plot. If I adjust the vertical height to accommodate an additional item above the "scans" flow (see difference between Chart 1 and Chart 2 images below), it pushes a portion of the charted information beyond the visible area.
If I attempt to adjust the plot area (or the chart area) it simply scales what is there and does not provide additional vertical space to work with.
This is a link to the template itself: https://create.microsoft.com/en-us/template/milestone-and-task-project-timeline-6abb6cbd-cdaa-4f51-af17-796e15ea9c80
My data/adjustments are pictured below
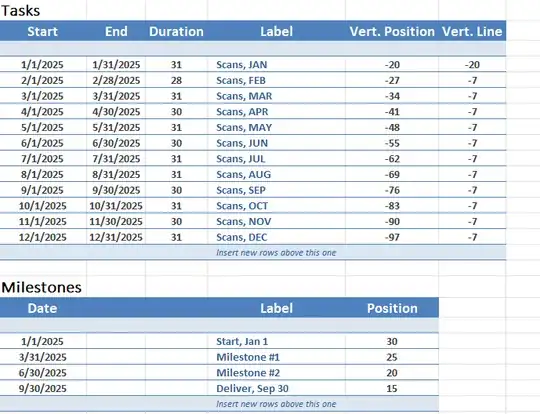
Chart1
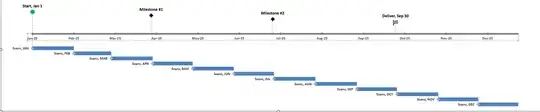
Chart2
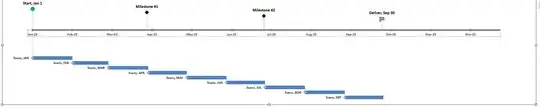
Data