You can use sqliteviz which I'm the author of. It is a free open-source offline-first PWA that allows you to convert a CSV file into SQLite database which runs in a browser with sql.js. After that, you can get your data with SELECT * FROM csv_import statement and create various Plotly charts against the result set.
Convert your CSV into a database
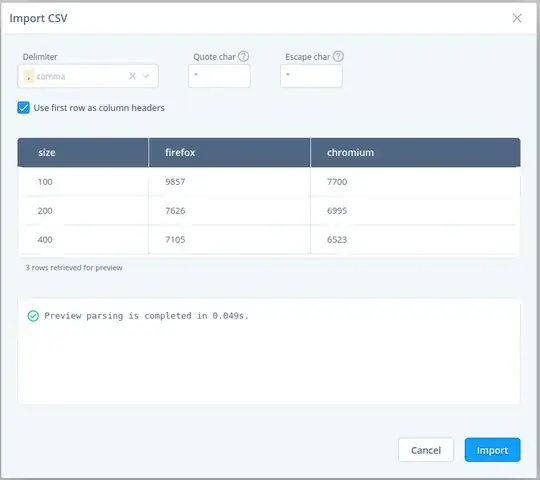
Choose your CSV file. Sqliteviz will show you the Import CSV dialogue with data preview. You can change parsing settings like delimiter character and others.
Get your data with SQL
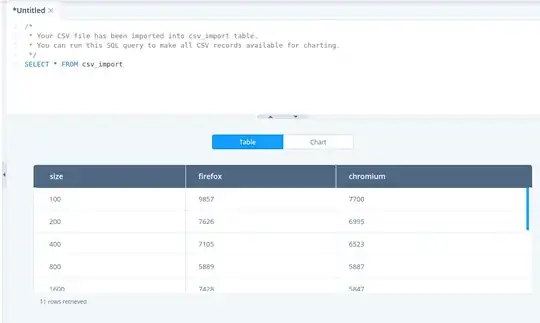
Now all records from your CSV are available as rows in csv_import table. Get them all with SELECT * FROM csv_import query.
Create a chart
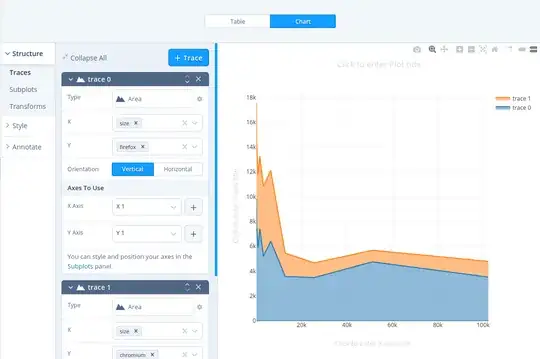
After running a query you can switch the result panel to the chart mode and create a chart with a react-chart-editor component. The same component with some additional features is used in Plotly Chart Studio. Explore its documentation to learn how to build charts with react-chart-editor. You can create various charts from simple line/bar/pie chart to financial candlesticks and scientific visualisation.
See sqliteviz documentation for more details.


