8

I have the following graphviz graph:

digraph finite_state_machine {
    a -> b [ label = "c" ];
}

The output of this graph should be

correct graph

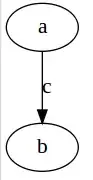
And this is indeed what I get if I try to use dot to generate a file (e.g. by dot -Tsvg test.dot > test.svg).

When I try to use dotty to display it, however, all the labels appear as periods:

incorrect graph

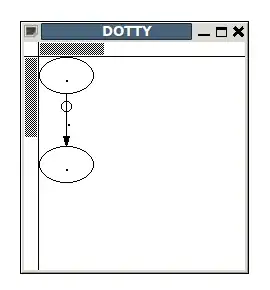
What causes this problem, and how can I solve this? I have used dotty a lot in the past on similar graphs, both on Windows and on Linux, and never saw this behavior.

Ubuntu 10.04.3 LTS, Graphviz version 2.20.2 (dotty version 96c).

badp
  • 3,797
Oak
  • 1,397

4 Answers4

5

My solution is too simple. I examined /var/log/Xorg.0.log and found the following:

[    52.308] (WW) The directory "/usr/share/fonts/X11/cyrillic" does not exist.
[    52.308]    Entry deleted from font path.
[    52.308] (WW) The directory "/usr/share/fonts/X11/100dpi/" does not exist.
[    52.308]    Entry deleted from font path.
...
[    52.314] (WW) The directory "/usr/share/fonts/X11/75dpi" does not exist.
[    52.314]    Entry deleted from font path.
[    52.314] (WW) The directory "/var/lib/defoma/x-ttcidfont-conf.d/dirs/TrueType" does not exist.
[    52.314]    Entry deleted from font path.

So, I installed the indicated packages:

xfonts-100dpi
xfonts-cyrillic
...
defoma
psfontmgr
x-ttcidfont-conf

I rebotted and Dotty graphs became beautiful, but the default font name remains unknown for me.

Synetech
  • 69,547
dyomas
  • 151
2

I have the same issue and did not find a solution yet, but I compiled a list of workarounds (some taken from https://bugs.launchpad.net/ubuntu/+source/graphviz/+bug/1016777):

  1. Specify a font name (attribute fontname="fixed" worked for me). Note that you can use global attributes in the beginning of the file to avoid having to specify it for every label:
  digraph cfg {
    graph [fontname="fixed"];
    node [fontname="fixed"];
    edge [fontname="fixed"];
    ...
  }
  1. Use dot (instead of dotty) and output the graph to an image file (e.g. dot -Tpng file.dot -o file.png), then use an image viewer. To avoid creating temporary files, use a viewer which supports reading from stdin, such as gwenview (e.g. dot -Tpng file.dot | gwenview /dev/stdin).

  2. Use xdot instead of dotty.

While these workarounds do not solve the actual issue, if all you need is to quickly view some graphs, they may be faster than trying to fix the issue (which still persists in Linux Mint 17, based on Ubuntu 14.04).

anol
  • 1,870
0

As others have mentioned your font configuration isn't working. You can read more about how to configure that here:

http://www.graphviz.org/doc/info/attrs.html#d:fontname

polynomial
  • 1,564
  • 8
  • 8
0

I've found some internal document in a company I briefly worked for that mentioned dotty is faulty on Ubuntu 10.04, and urging users to upgrade their OS as a way to solve that. The reason this happens is still a mystery to me, and "upgrade your OS" is a pretty poor solution, but still - it should solve the issue, so posting it here as an answer.

Oak
  • 1,397