1

Is there an application or website that takes CSV files, loads them into a DB, allows SQL queries to be run on them and then creates charts or graphs with the results?

** Update: I installed MAMP, and that was very painless. ** Here's the import statement for anyone who comes across this:

LOAD DATA LOCAL INFILE '~/musicdata.csv' INTO TABLE MusicData FIELDS TERMINATED BY ',' LINES TERMINATED BY '\r' (DistributionYear, `Distribution Quarter`, `Statement Recipient ID`, `Statement Recipient Name`, `Party ID`, `Party Name`, `Legal Earner`, `Legal Earner Party ID`, Performance, `Music User Genre`, `Music User`, `Network Service`, `Performance Start Date`, `Performance End Date`, `Survey Type`, `Day Part Code`, `Series or Film/Attraction`, `Program Name`, `Work ID`, `Work Title`, `CA%`, `Classification Code`, `Number of Plays`, `Performance Type (Usage)`, Duration, `Performing Artist`, `Composer Name`, `EE Share`, Credits, Dollars, `Premium Credits`, `Premium Dollars`, `Adjustment Indicator`, `Adjustment Reason Code`, `Original Distribution Date`, `Role Type`);
Hennes
  • 65,804
  • 7
  • 115
  • 169
patrick
  • 1,273

3 Answers3

3

Microsoft's Log Parser is ready-made for this. No need to log data into a database.

More here

uSlackr
  • 9,053
2

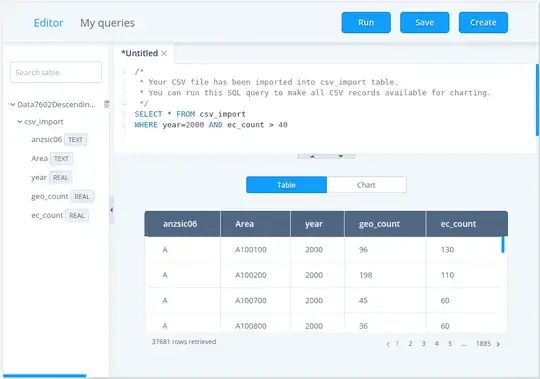
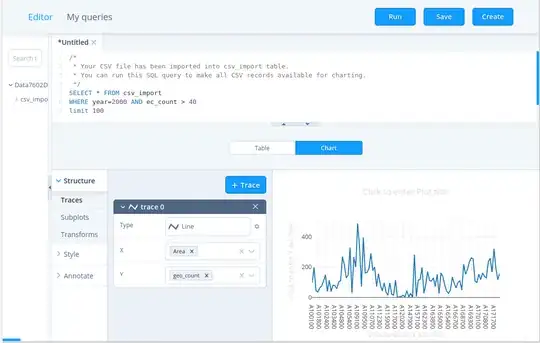
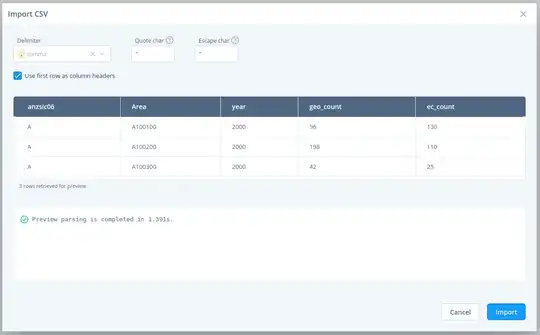
sqliteviz (which I'm the author of) has everything you need. It is a free open-source offline-first PWA that allows you to convert a CSV file into SQLite database which runs in a browser with sql.js. After that, you can filter your data with SELECT statements and create various Plotly charts against the result set.

Convert your CSV into a database

Choose your CSV file. Sqliteviz will show you the Import CSV dialogue with data preview and parsing settings like delimiter character and others. sqliteviz CSV import dialogue

Filter your data with SQL

Now all records from your CSV are available as rows in csv_import table of SQLite database. Filter them with SQL. sqliteviz query result set

Create a chart

After running a query switch the result panel to the chart mode. Here you can create a chart with a react-chart-editor component. The same component with some additional features is used in Plotly Chart Studio. Explore its documentation to learn how to build charts with react-chart-editor. You can create various charts from simple line/bar/pie chart to financial candlesticks and scientific visualisation. sqliteviz chart example

In sqliteviz you can also save often-used queries and import/export them. See sqliteviz documentation.

Lana
  • 151
  • 2
1

You can install MySQL, with the phpMyAdmin frontend management tool. It allows you to import CSV files to a table. Of course, you have to define the table and database schema beforehand.

Then, you can run SQL queries with phpMyAdmin, which is pretty straightforward. PMA also supports Charts.

The results can be exported as CSV again. Actually, graphing or producing charts is not as easy as you might think. To make assumptions about the data format, or the kind of graphs you want to produce, a graphing utility has to be very powerful. Various tools exist, some of the more popular ones:

slhck
  • 235,242