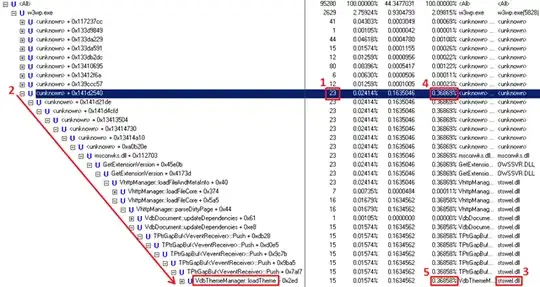
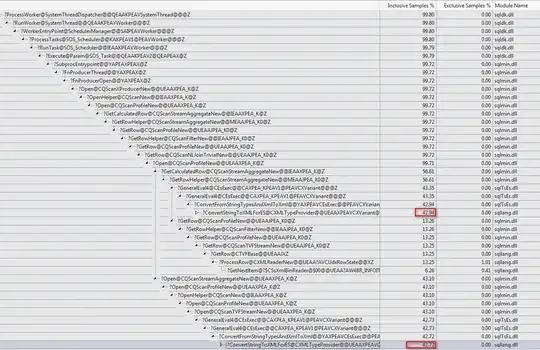
Occasionally when investigating SQL Server issues I find it useful to be able to attach the Visual Studio debugger to it and try and figure out what it is doing by looking at the call stack (the public symbols are available and often it is possible to infer useful information from the method names).
A great example of the type of internals information that can be inferred is in this blog post which inspired my attempts.
This can be quite a time consuming and tedious process however. Generally I run the code of interest in a loop attach the debugger then continually break and continue until I hit a call stack that looks interesting to the matter under investigation. I can then step through the code and look at the method names being called. This takes ages however.
Is there any way of automating this so I can simply log all the methods called for a short period then review the log file afterwards?

