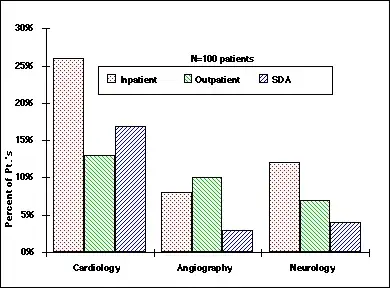
I would like to produce a grouped categorical histogram with LibreOffice Calc. With grouped I mean an histogram with N columns instead of a single one for each category.
Something like this:
Any clue?
I would like to produce a grouped categorical histogram with LibreOffice Calc. With grouped I mean an histogram with N columns instead of a single one for each category.
Something like this:
Any clue?
I am trying to provide an answer for new users who want to generate basic Histogram in Libreoffice Calc.
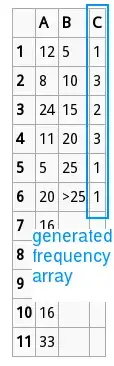
The first step is to make the frequency array.
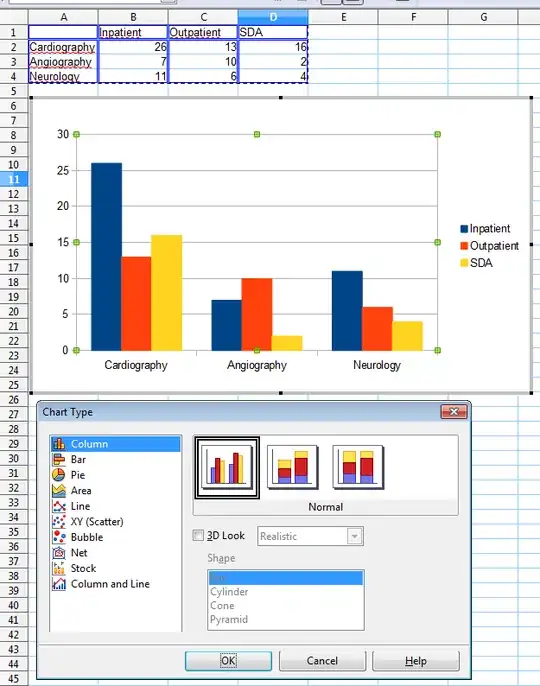
The second step is to generate a Bar Graph based on the frequency array.