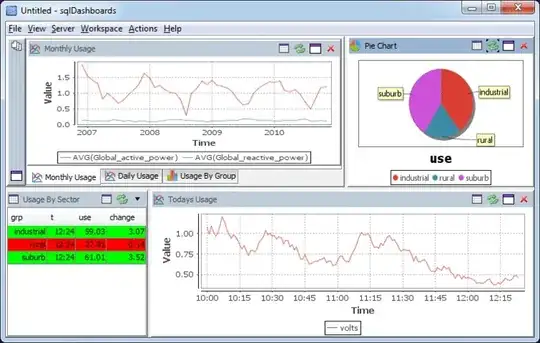
I am looking for a free data graphing application that can pull data from MySQL and display it on a trend graph without any programming. It should use a GUI to select the data to be plotted, start time, end time etc. Ideally it could be historical data or live real-time data.
- LiveGraph looks like it has all the features but it works with CSV data
- Cacti is similar but it requires the data to be in RRDtool
Is there anything similar that is designed to retrieve data from a SQL database?
