Given the following paths on a directed graph:
(A --> B --> C)

(C --> B)

(C --> A)
I want to find a way to generate a visual representation for this directed graph. Is there any available software that is capable of doing this?
Given the following paths on a directed graph:
(A --> B --> C)
(C --> B)
(C --> A)
I want to find a way to generate a visual representation for this directed graph. Is there any available software that is capable of doing this?
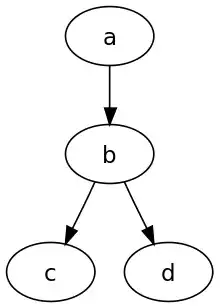
You can use dot of the graphviz suite. Here's a simple example of the language.
digraph graphname {
     a -> b -> c;
     b -> d;
 }
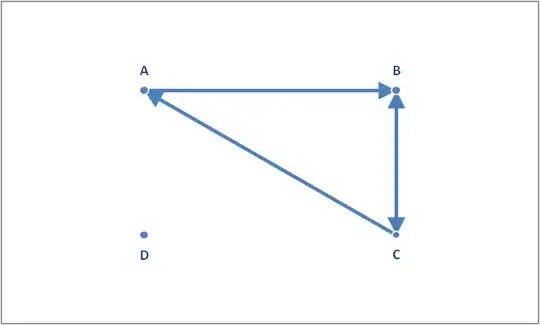
You can do graphs like this using an Excel Scatter (XY) chart. Generally, the best way would be to:
The result could look something like this:
The R language is ideal for this, especially with large/changing datasets. Here's a simple guide.
You'll need an R development enviroment, I use revolution analytic's.