0

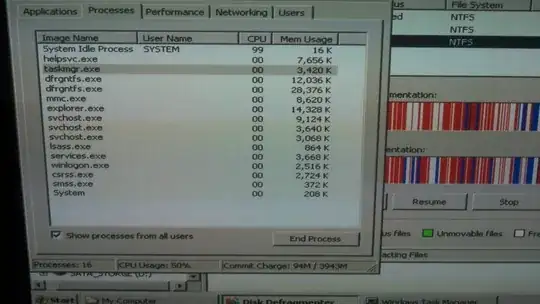
I think I have a hard drive or video card dying in my HTPC. It's a dual core CPU and one processor is almost always at 100% usage, but processes are all nil, System Idle Process is at 99%

It's a pretty bare bones PC used as an HTPC, OS is WinXP SP2. 2GB of RAM.

Things Ive tried: - I have run a full virus scan and nothing turning up - Ran HDDScan and the drive showed as healthy with S.M.A.R.T. readings - I'm running a defrag and its going EXTREMELY slowly. It is a 500GB drive with 37% free and ~50% fragmentation. I've let it run for 24 hours and it is at 16% complete.

Ive read some articles about a piece of hardware going bad and issuing too many interrupts? Is there somewhere out there I can use to verify or monitor this? Im not sure how to pin down what is bad...

Could it be RAM? (MEMTEST?) Video card (not sure how to test this?), Harddrive?

Im stuck in my troubleshooting at this point.

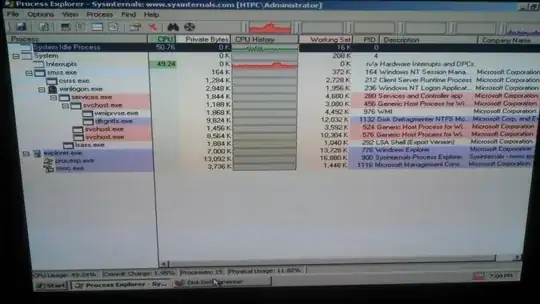
EDIT This post seems to recommend process explorer, didnt know it worked on XP. I will be trying this

EDIT 2

Image of Task Mgr

enter image description here

EDIT 3

Power outage due to a storm. Because of that I was able to install Process Explorer, what can I check with this tool? It does show interrupts using 50% of the CPU.

enter image description here

3 Answers3

5

Drive

I'm running a defrag and its going EXTREMELY slowly

<p>Can you see the HDD LED? Is the drive thrashing? What happens if you stop the defrag; does the drive usage stop? </p>

Hit pause on defrag and CPU stayed pegged at 50%

But what about the drive? Does the drive still thrash even if you stop the defrag? If you can’t see the LED, try listening to the system to hear the drive. Is it being used a lot? Check DiskMon to see if the drive is being heavily used. If so, then you can use Process Monitor to find out what program/driver it is and try shutting down/killing it.

CPU

It's a dual core CPU and one processor is almost always at 100% usage, but processes are all nil, System Idle Process is at 99%

<p>Did you check the kernel times? Task Manager ⇨ Performance ⇨ View ⇨ Kernel Times</p>

It looks similar to your pic, not sure if I can desribe it, bar chart on left is 100% red, graph chart the red and green lines are essentially the same, green and red same plots. Do you need a pic of this?

If the numbers in the Processes tab are low (~0%), but the red line is high in the Performance tab, it means that there is a driver that is malfunctioning. You need to figure out which one is causing trouble. Process Explorer is the quickest and easiest way to do that (available for XP SP2 and up):

  • Open Process Explorer
  • Right-click somewhere in the column-header and select Choose Columns
  • In the Process Performance tab, check the box for CPU History and click [OK]
  • Look for the process that is showing a high usage

Once you have figured out which driver is the problem you can try stopping or restarting it depending on what it is. If the driver is part of a program like an anti-virus program, then you should be able to kill it in Device Manager. If it is a hardware driver, you may be able to restart it, but it might crash the system or make the system unusable (e.g., a video driver), so a reboot would be required to stop it.

After you have stopped the drier from pegging the CPU, you need to find out why it is doing that. If it doesn’t happen again, it may have been a cosmic ray. If it happens again, you should see if there is an update available and also file a bug-report.

Testing

Could it be RAM? (MEMTEST?)`

Video card (not sure how to test this?)

Harddrive?

Synetech
  • 69,547
2

Open device manager, remove the IDE/SATA controller, reboot and let Windows reinstall the drivers. The high Interrupt usage can be caused by running in slow Multi DMA mode or even more worse in PIO mode instead of Ultra DMA.

If this doesn't fix it, use KernRate to see what causes the CPU usage.

0

Hard drive was dead. Swapped it with a different SATA and was back in business.

Thank you everyone for your help.