1

I have matlab matrix 100x100, which I want to draw in Sage Notebook. I run

plot(open(DATA+'matlab.mat'))

I get

verbose 0 (2387: plot.py, generate_plot_points) WARNING: When plotting,
failed to evaluate function at 200 points.
verbose 0 (2387: plot.py, generate_plot_points) Last error message:
''file' object is not callable'

and as picture

enter image description here

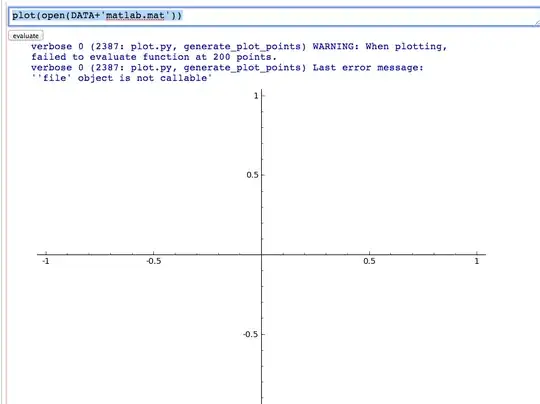
and an empty figure.

How can you plot Matlab's .mat data in Sage Math Notebook?

2 Answers2

1

Your first step will be to actually read the files; they are not raw data, but a (presumably proprietary) raw file type. See this Stackoverflow question for how to get them into Python.

Once you have things in a Scipy or Numpy array, you should be able to convert. Sage code:

import numpy
l=numpy.array([[1.0,2.0],[2.0,3.0]],dtype=float)
M = matrix(l)
M

However, keep aware that this functionality perhaps isn't used as much, so there may be subtle things you have to do - for instance, I had to declare the data type of my Numpy array.

kcrisman
  • 143
1

Example of the code that works, deduced from the Sage support forum:

import matplotlib.pyplot as plt
import scipy.io
data = scipy.io.loadmat('arrytmia_data_bad.mat')
x = data['data']
plt.plot(x, linestyle='', marker='x')
plt.savefig('a.png')         # vs Python: plt.show()