3

I am trying to write an excel formula (or formulas) to count the first occurrence of a value in a given year for each Person in my table. I've searched for related questions on Superuser to no avail. To give you some context, each Person participated in one or more years at an exam. During each exam year, they were given one or more scores (values 1 through 9 in the table). For example, Person A had two scores (5,3) in 2011, one score (2) in 2012, and two scores (4,1) in 2013. However, I am only interested in tallying how many years each Person had participated and I don't care which years they were. My data follows:

Person  2011    2012    2013
A       5       
A       3                       
A               2
A                       4
A                       1               
B       7                       
B                       6               
C       1                       
C       9                       
C               4                   
C               2                   
D       5                       

This is the result I want:

Person  Years                       
A       3                       
B       2                       
C       2                       
D       1       

I've tried so many convoluted/inefficient ways to achieve this result using a combination of SUM, COUNTIFS, and VLOOKUP, but it always counted all values and not first occurrence of a value in a given year. I just can't figure out how to do it or if it's even possible using excel functions. I don't know VBA, but I suspect it may be required for this. Thanks in advance for your help.
Dre
  • 143

2 Answers2

3

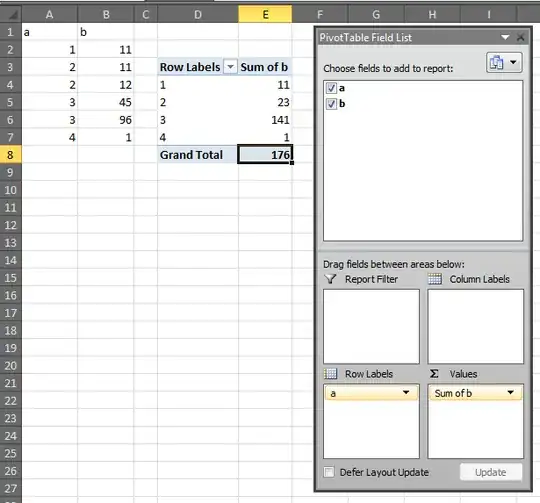
Sounds like a job for pivot table!

Highlight your table and go to Insert → pivot table and arrange it how you want. I'd do the following -

enter image description here

Raystafarian
  • 21,963
  • 12
  • 64
  • 91
1

Thanks to Raystafarian's comment, I am able to provide a detailed answer to my own question. Using a pivot table, I select my entire table range. In the PivotTable Field List dialogue, I add Person to the report, then drag each year (i.e. 2011, 2012, 2013) unchecked into the Values field. Doing so gives me this initial result:

Row Labels     Count of 2011    Count of 2012   Count of 2013
A              2                1               2
B              1                                1
C              2                2   
D              1        
Grand Total    6                3               3

This is fantastic as it not only enables me to COUNT the number of values per row, indicating how many years each person participated, but it also tells me how many scores were given per year for each person.

So in my final step, I simply add the formula =COUNT(B2:D2) in cell E2 whereby Column A = Row Labels, Column B = Count of 2011, Column C = Count of 2012, Column D = Count of 2013, Column E = Years and get this result:

Row Labels     Count of 2011    Count of 2012   Count of 2013     Years
A              2                1               2                 3
B              1                                1                 2
C              2                2                                 2   
D              1                                                  1  
Grand Total    6                3               3                 
Dre
  • 143