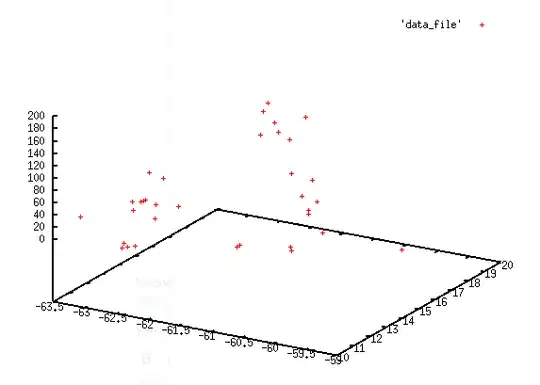
I have a file which contains x,y,z data. Actually, the data is:
x = latitude y = longitude z= Depth
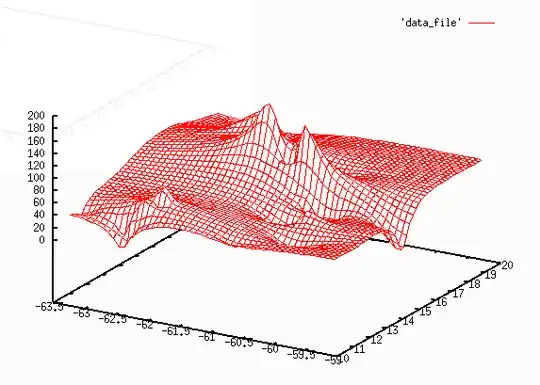
I want to create a smooth surface but I have no idea how to do it. Could anybody give me some hints to do it?
UPDATE
So, the data looks like the next lines:
-62.323 19.242  58.7
-62.213 10.886  120.2
-62.329 10.797  71.9
-62.383 10.690  1.3
-60.121 11.567  24.5
-60.481 12.894  3
-62.118 10.944  69.1
-60.825 15.803  25.5
-61.792 16.227  148.3
-63.288 10.817  28.4
-59.092 14.344  3
-61.836 11.217  67.7
-61.346 14.799  191.2
-61.152 15.427  126.6
-60.959 16.035  55.8
-61.364 15.283  151.6
-62.071 11.222  109.5
-62.420 10.672  72.1
-60.267 14.009  13.1
-60.604 14.033  65.4
-60.623 10.307  42.4
-62.272 17.936  75
-60.464 13.908  40.9
-60.722 14.701  181.5
-62.125 10.911  47.1
-62.530 10.544  5.2
-60.170 12.752  71.5
-60.929 14.635  87.9
-62.279 10.936  74.3
-62.267 10.767  75.8
-60.708 10.440  36.2
-62.440 10.463  2.6
-62.477 10.217  3
-62.399 10.651  58.7
There are more points. The idea is to create the plane or surface along the depth (the third column).