0

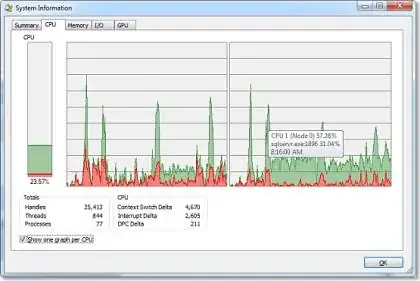
i have checked the 'affinity' of all my processes and all of them are set to all CPUs, yet I check my CPU usage and my 2nd CPU (it's called #1 because my first CPU is #0) is jumping around 90% and it's stuck there until I close basically everything that uses the CPU.

I have tried to search for solutions before. I have been told that it's some old Windows program that auto updates and glitched out. I have heard that it's a malware/Trojan-virus. I've tried downloading a few programs that are supposed to notify me whenever a process uses a lot of of CPU, and the programs are either broken or it's not a process.

Even right now my CPU usage is at 50%, and the only things I have open are the internet and Steam. I have around 8.2GB of RAM. I have 6 CPUs ~ 2.7 GHz each, and a AMD Phenom II X6.

I don't know everything about tech, but I don't need anything to be dumbed down for me.
karel
  • 13,706

2 Answers2

0

To see what's going on: ctrl+alt+del, 'Start Task Manager', 'Processes' tab, click on the 'CPU' column to sort processes from highest to lowest.

This should give you some preliminary insight to what's hogging up your CPU.

If you don't see that process, click 'Show processes from all users'.

This instructions are for Windows 7, other versions may have minor differences.

On a side note, by opening 'The Internet' you probably mean IE/Chrome/Fifrefox. Some web pages can take a lot of processing power, especially on Internet Explorer.

If your browser is the culprit then close tabs until the CPU stabilises. Start with flash-heavy tabs.

zamber
  • 121
0

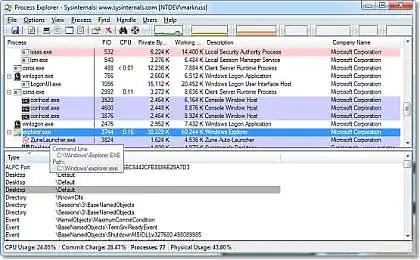
If task manager does not show you what you are looking for (and it might not), I suggest downloading a tool from SysInternals called Process Explorer. Here is the blurb from the SysInternals site

Ever wondered which program has a particular file or directory open? Now you can find out. Process Explorer shows you information about which handles and DLLs processes have opened or loaded.

The Process Explorer display consists of two sub-windows. The top window always shows a list of the currently active processes, including the names of their owning accounts, whereas the information displayed in the bottom window depends on the mode that Process Explorer is in: if it is in handle mode you'll see the handles that the process selected in the top window has opened; if Process Explorer is in DLL mode you'll see the DLLs and memory-mapped files that the process has loaded. Process Explorer also has a powerful search capability that will quickly show you which processes have particular handles opened or DLLs loaded. The unique capabilities of Process Explorer make it useful for tracking down DLL-version problems or handle leaks, and provide insight into the way Windows and applications work.

sysinternals process explorer 1 2 3

Here is the URL to download Process Explorer. Very handy little tool..

http://technet.microsoft.com/en-us/sysinternals/bb896653

Richie086
  • 5,351