Is there any plot digitizer usable in Excel? I have discrete points (values X and Y) and I have to create graph from these - Excel can create the "mean curve" (I am sorry, I am not a native speaker so I might not use the right terms). My problem is: I need to find Y valus for any X from this graph (it shoud work automatically while changing the X input, because the Y value is used for subsequent calculations). As I have no equation of the graph, it is impossible to just evaluate the values from the equation. So is there any way that would enable to just choose X and output in another field would be the appropriate Y value? Or do you know another software that could be used for creating such graph as in Excel and would have such function? Sorry for my english and thanks in advance!
Asked
Active
Viewed 808 times
2 Answers
1
In order to extract the equation behind an Excel calculated trendline, you just need to to right-click on the line/curve and select "Display Equation on Chart":
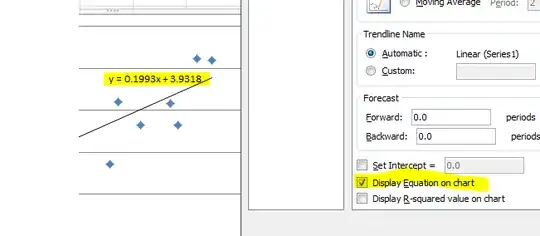
Then, you can create a formula matching this equation by hand.
Madball73
- 2,590
0
You can use Excel to fit a trend line or curve to your data (also known as a regression; is that what you're referring to when you say "mean curve"?), and then plug x-values into the equation of said trend line/curve to get y-values back.
Pockets
- 290
- 3
- 9