5

Suppose I have an Excel sheet with below data

 CODE (COL A) | VALUE (COL B)
==============================
  A01         | 10
  A01         | 20
  A01         | 30
  A01         | 10
  B01         | 30
  B01         | 30

Is there an Excel function working like ..


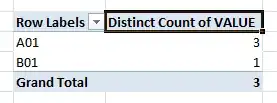
SELECT CODE, count (Distinct *) FROM TABLE GROUP BY CODE


 CODE    | Distinct Count of Value
===================================
  A01    | 3
  B01    | 1

or, better yet, can I have an Excel formula pasted in column C to get something like this:

 
 CODE (COL A) | VALUE (COL B) | DISTINCT VALUE COUNT WITH MATCHING CODE (COL C)
===============================================================================
  A01         | 10            | 3
  A01         | 20            | 3
  A01         | 30            | 3
  A01         | 10            | 3
  B01         | 30            | 1
  B01         | 30            | 1

I know I can use pivot table to get this result easily. However due to reporting requirements I have to append the "distinct count" column to the Excel sheet, hence pivot table is not an option.

My last resort is to use Excel macros (which are fine), but before that I would like to learn whether Excel functions can accomplish this kind of task.

Solo
  • 173
  • 2
  • 2
  • 7

3 Answers3

7

Enter this formula in cell C2, assuming you have data in rows 2 through 7,

=SUMPRODUCT(($A$2:$A$7=A2)  /  COUNTIFS($B$2:$B$7, $B$2:$B$7, $A$2:$A$7, $A$2:$A$7))

and drag it down.

How it works:

When SUMPRODUCT is given a list of scalar arguments, it works like SUM, but it will take an array as an argument without special array entry.

The array is populated with zeroes for records that don't match the CODE value in column A. For those that match, the array is populated with 1/(the number of records that have the same A and B values as this record). So, for example, there are two records that have A=A01 and B=10, so for those two records 1/2 (½) is entered in the array. Think of this as a kind of weighting for duplicate values. Whenever these values are summed, the sum for each unique B value is 1 (in the example, the two records would sum ½+½=1). This gives the count of distinct records.

Full example using your example data:

For any record with A=A01, the formula would return the sum of {½,1,1,½,0,0}=3.
For any record with A=B01, the formula would return the sum of {0,0,0,0,½,½}=1.

Excellll
  • 12,847
2

Here’s an approach that’s a bit easier to understand than Excellll’s, but it does require an extra column. Assuming that your data are in Rows 2 through 7 (Columns A and B), enter this in C2:

=COUNTIFS($A$2:$A2, $A2, $B$2:$B2, $B2)=1

and this in D2:

=COUNTIFS($C$2:$C$7, TRUE, $A$2:$A$7, $A2)

and drag down.

How it works:

COUNTIFS($A$2:$A2, $A2, $B$2:$B2, $B2) counts how many rows above and including the current one have the same A and B values as the current row.  This will be 1 on the first occurrence of a value pair (Rows 2, 3, 4, and 6) and higher on rows that are repeating a value pair that occurred above (i.e., it will be 2 on Rows 5 and 7).  Testing whether it’s 1 yields TRUE on the first occurrence of each distinct value pair and FALSE elsewhere.  Then the formula in Column D counts how many TRUEs there are for the current value of A.

You can simplify the formulas a little:

C:    =COUNTIFS($A$2:$A2, $A2, $B$2:$B2, $B2)

D:    =COUNTIFS($C$2:$C$7, 1, $A$2:$A$7, $A2)

and of course you can hide Column C.

0

I would use the Power Pivot Excel Add-In. It eats Distinct Counts for breakfast ...

First I would add the Excel table to Power Pivot using the Create Linked Table button on the Power Pivot ribbon.

Then I would use the PivotTable button on the Power Pivot ribbon to create a Pivot Table, dragging the Code (Col A) column into the Row Labels zone and the Value (Col B) column into the Values zone (in the Power Pivot Field List).

By default the Values field will be aggregated as Sum of Value (Col B). I would change this by clicking the Sum of Value (Col B) entry in the Values zone and choosing Summarize By, then Distinct Count.

Here's a screenshot of the result

distinct count example

Mike Honey
  • 2,632