I'm looking for a simple way to chart a list of values each correlating to a date. For example:
Date Value
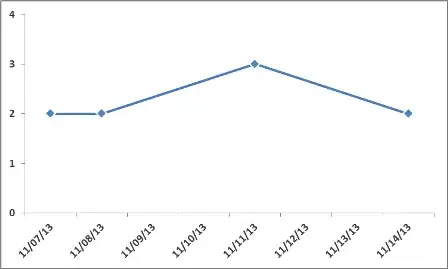
11/7/13 2
11/8/13 2
11/11/13 3
11/14/13 2
Etc. The problem is, the chart does not show a proper trend since many dates have no occurrences or value for that date. So, in the chart, things look fine, but are distorted since there are no dates with a value of 0. How can I fill in this sequence of dates with 0 values for the missing dates?
I am looking for the simplest possible approach. If I wanted to bypass Excel, I could just adjust the input data with Perl or something.