0

If I have the following Table1 in Excel

Name    Age Sex
Pablo   28  Male
Victor  32  Male
Juan    33  Male
Pedro   40  Male
Jacinta 24  Female
Laura   39  Female

And Table2

Sex    Color
Male   Blue
Female Pink

How can I create a table (or pivot table, or just a simple Excel range) that can relate both tables through the Sex field?
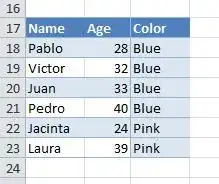
Name    Age Color
Pablo   28  Blue
Victor  32  Blue
Juan    33  Blue
Pedro   40  Blue
Jacinta 24  Pink
Laura   39  Pink

I know I can use VLOOKUP or INDEX-MATCH, but I'm looking for a more elegant solution using Excel data model.

Excellll
  • 12,847
Victor
  • 103

1 Answers1

0

You could use a VLOOKUP within an IF statement to look up the name and get the value of the 3rd column. Then see if it equals Male. If its true, return Blue. If its false, return Pink.

=IF(VLOOKUP(A18,Table1[#All],3,FALSE)="Male", $H$2, $H$3)

I created the table example you gave at A1 and made it Table1. Then created Table2 at G1:H3. I created the new table at A17:C23, thus the reference to A18 at the begining of the VLOOKUP.

enter image description here

CharlieRB
  • 23,021
  • 6
  • 60
  • 107