Before I say anything at all, I want you all to know where I've been with this issue:
- I have run multiple AV scans, including: Malwarebytes, Sophos Virus Removal, ADWCleaner, ESET Smart Security 4 & Hitman Pro which did find some PUPs and remove them.
- I have RAMMap, Windows WDK with Poolmon & Process Explorer installed.
- I have updated all drivers, disabled all useless (aka unused/not needed) processes and services and restarted my computer multiple times over the course of yesterday and today (when the issue began).
- Please, when I talk about this issue, don't tell me that unused RAM is wasted RAM as a valid answer to my issue. The issue is not that simple. When my RAM fills up, I experience performance issues and slowdowns of my system that I was not experiencing before, including the RAM being maxed out and system stuttering/performance issues when it is maxed out, forcing me to restart my computer.
Here are my System Specs:
Operating System: MS Windows 7 Ultimate 64-bit SP1
CPU: Intel Core i7 960 @ 3.20GHz 48 °C Bloomfield 45nm Technology
RAM: 6.0GB Triple-Channel DDR3 @ 534MHz (8-8-8-20)
Motherboard: ASUSTeK Computer INC. SABERTOOTH X58 (LGA1366) 35 °C
Graphics: NVIDIA GeForce GTX 670
Hard Drives: 2930GB Seagate ST3000DM001-1CH166 ATA Device (SATA) 30 °C
Audio: Realtek High Definition Audio (From Motherboard)
What I have found out using poolmon is that I have a driver or something else that is not releasing frees and is steadily increasing named "Proc".
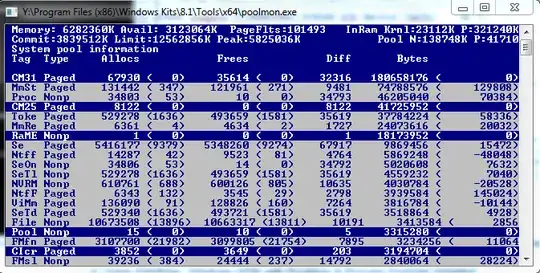
As you can see, Proc has a whopping 10 frees and 46205040 bytes being used. And that number is always climbing.
What I have found from pooltag.txt (if anyone is reading this and is interested as to where to find this file, you can look here: Y:\Program Files (x86)\Windows Kits\8.1\Debuggers\x64\triage), is this description: "Proc - nt!ps - Process objects", which is pretty uninformative given the generic description. Either way, this issue seems to compound when I run a highly intensive process (such as World of Warcraft which normally takes up 1.6GB of RAM).
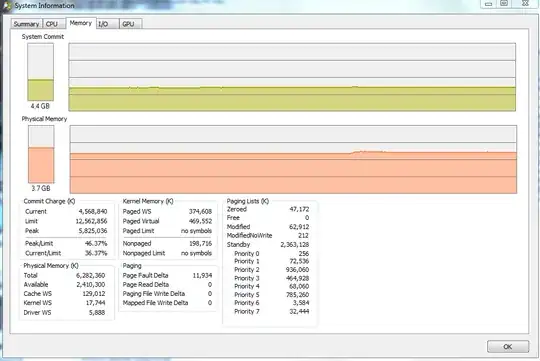
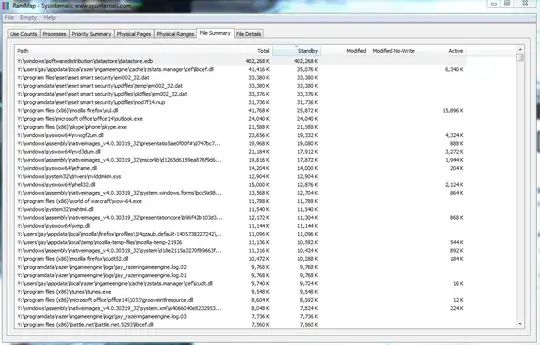
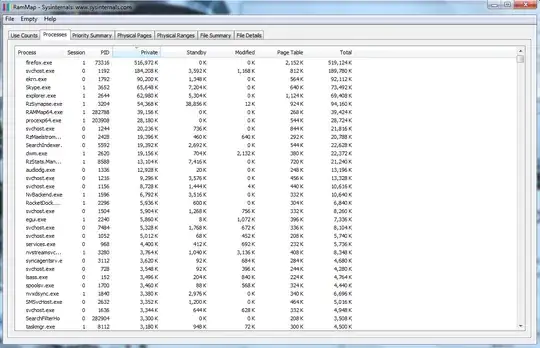
When that process is ended, RAM usage remain as if the program never closed. When I look at RAM map, sometimes over 1.5GB is remaining in standby. Even when I clear it in RAMMap, it does not clear it and that ram is not freed up to be reused.
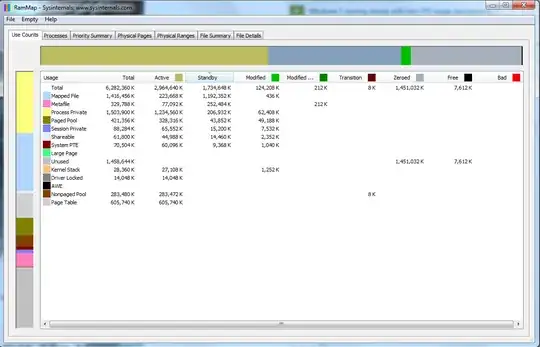
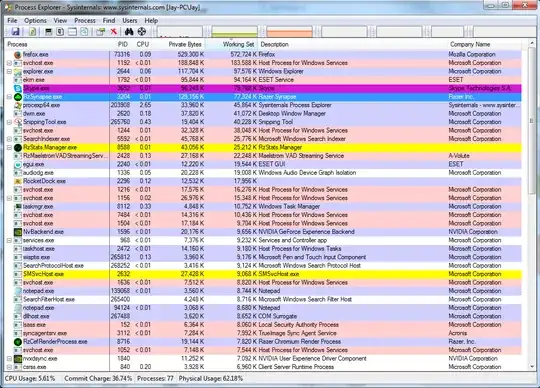
As you can see here, I have 2.9GB used (due to Firefox, Skype and a few other programs), but I have over 1.5GB in standby that is unused, and TaskManager & Process Explorer report that I'm using closer to 4GB.
One more issue that I've been noticing: I had updated my Ethernet Drivers due to some lag issues I was experiencing with my internet (had a modem replaced and then updated them). The problem went away. I left for Thanksgiving for about a week, at which time my computer was off. When I returned home, I noticed that process: "svchost -k LocalSystemNetworkRestricted", "svchost -k netsvcs" would at times be using over 500-700MBs of RAM, which I had never seen before. Right now it is sitting around 164MB, but I had not even seen it come up near that number before I left.
I looked over all the programs, uninstalled a few that I had installed before I left, then did virus scans which removed some more stuff, and even rolled back my Ethernet driver. The only updates I had for Windows 7 were for Windows Defender (which I have subsequently disabled). Yet this strange behavior remains.
In a nutshell:
- Driver or System Resource "Proc" (full description: "Proc - nt!ps - Process objects") as shown in PoolMon.exe is steadily climbing in bytes used but is not freeing them, eventually maxing RAM and causing system instability and stutters
- "svchost -k LocalSystemNetworkRestricted" & "svchost -k netsvcs" processes have increased usage in RAM, despite anything hardly changing in the system.
Please let me know if anyone can help me.