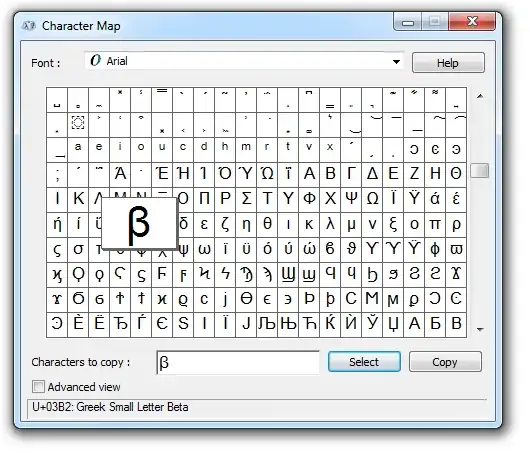
I'm creating a Weibull plot in Excel 2010. Each line on the chart needs a legend of this form:
my 1st data [n=250, b=2.401] { where "b" should really be a lowercase Greek beta }
my 2nd line [n=331, b=2.395] { where "b" should really be a lowercase Greek beta }
...
For the sake of example, let's say "my 1st data" is found in cells A2:B20 (x values in column A, y values in column B), and the title for that data is in cell B1 as follows:
="my 1st data [n="&text(nval,"#")&", b="&text(beta,"#.###")&"]"
Therefore, to plot "my 1st data" my chart contains this series:
=SERIES(B1,A2:A20,B2:B20)
I can format the "b" in the formula in cell B1 such that it appears as the Greek letter (lowercase) beta. (Even that's a bit tricky, but I can do it, and the result of the formula looks perfect when viewed in cell B1 directly.)
Here's the problem: on the chart itself, the legend apparently overrides the formatting of individual characters, and everything reverts to the default font in the legend. Obviously I can't format the entire cell as "Symbol" font, because then everything in the legend turns into symbols, which is even worse. Can somebody tell me if they've figured out how to to this?
Thanks,
Roger
