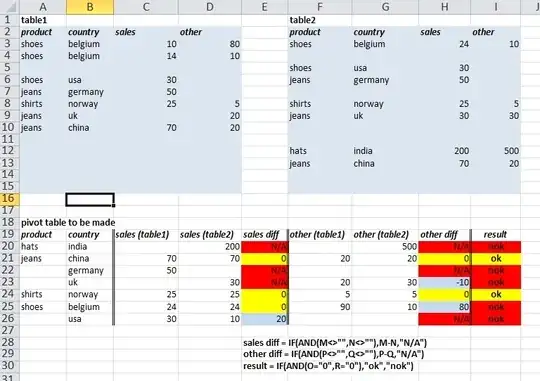
I have 2 tables (table1, table2), each with 2 categorical variables/columns (product, country) and up to 5 real-valued variables to be reconciled/compared against each other (sales and other in the example below). Datasets can have unique categorical variables, e.g. only table2 has product = hats or only table2 has country = India for a product. There are also blank rows.
As far as I know, a pivot table with multiple consolidation ranges is an ideal tool for my purposes of reconciliation. I have drawn an example of input data (two ranges) and wanted output (pivot table). As you can see, the pivot table displays both categorical variables, then repeats values for the first variable in both tables, then uses calculated fields with their difference and the same for the second variable. The last column gives a user an insight on whether the entry is consistent/reconciled.
I know how to start a session with multiple consolidation ranges (ctrl+d, p), but I find it impossible to use two row labels (product, country) within it, let alone display values from both tables and use calculated fields for differences and reconciliation status/result. Any tips?
pic: