OpenSCAD User Manual/Importing Geometry/Surface Method
Surface() Object Module: Apply a Height Map
The Surface module draws a surface based on the Height map information given either as numbers in a text data file, or by interpreting the luminance of each pixel in a PNG image file (only).
The generated surface is normally drawn from the (0,0) origin in the +X,+Y quadrant. The extent of the drawn surface is either:
- data file - the number of columns and rows in the file
- image - the number of pixels in each direction of the image.
To make a surface of size (m,n) there must be n rows of numbers, with m values on each row.
Height values from an image file are massaged to the range of 0-100 and so will not have negative values, unless the invert option changes the sign of all the height values.
Height values are applied starting at the [0,0] corner. The column index and the X coordinate are both increased by one and the next value applied at the next position on the surface. Continue like this to the end of the row and then increase the Y coordinate, and the row index, by one as the row is completed. Repeat until all the rows are processed.
For a data file of size (m,n) the generated surface is grid of squares with the height value applied at the left-lower corner (as seen here). The n-th row of heights will be on the top vertices of the squares along the top edge of the surface:
 ^  [x,y+n] [x+m,y+n]
 |
 y  [x,y]   [x+m,y]
[0,0] x-->
A one unit thick base is drawn downwards under the generated surface from the level of the smallest value in the data file, including when heights have negative values. This means that when least height value is zero the base will extend down to z=-1.
Parameters
- filename
- Required String. The filename may include an absolute or a relative path to the height map data file. There is no default so the .png extension must be explicitly given.
- center
- Optional Boolean, default=
falseto draw in the +X,+Y quadrant. Whentruethe surface is centered on the X-Y origin. - invert
- Optional Boolean, default=false. Limitation: Only applies to image based maps
. Inverts how the pixel values are interpreted into height values.[Note: Requires version 2015.03]
- convexity
- Integer, default=1. Higher values improve preview rendering of complex shapes. Limitation: Only used by OpenCSG Preview
Text Data Format
A text data height map is simply rows of whitespace separated, floating point numbers. The values may be written as integers, floating point with decimal fractions, or using exponential notation such as 1.25e2 for 125.
Hex values are not accepted but may not give a warning.
Consider a data file with n rows and m values on each, thus having size (m,n). The X position of each data point is given by their position along their row, and the Y by the row. The implicit indexing starts at the beginning of the file with the first row being at Y=0 and the first point on each row at X=0. The X and Y positions increment by one until X=m and Y=n, which means that the last row of values is the farthest edge of the generated surface.
The appearance of a hash sign ('#') as the first, non-whitespace character on a line marks it as a comment. A hash mark following numbers on a row cause a lexical fault making the data file unreadable.
Examples Using Data Map
//surface.scad
surface(file = "surface.dat", center = true, convexity = 5);
%translate([0,0,5]) cube([10,10,10], center = true);
The transparent cube shows the extent of the data space, and that the base extends downwards to Y=-1.
#surface.dat
10 9 8 7 6 5 5 5 5 5
 9 8 7 6 6 4 3 2 1 0
 8 7 6 6 4 3 2 1 0 0
 7 6 6 4 3 2 1 0 0 0
 6 6 4 3 2 1 1 0 0 0
 6 6 3 2 1 1 1 0 0 0
 6 6 2 1 1 1 1 0 0 0
 6 6 1 0 0 0 0 0 0 0
 3 1 0 0 0 0 0 0 0 0
 3 0 0 0 0 0 0 0 0 0
Result:

One may use an application like Octave or Matlab to make a data file. This is a small Matlab script that superimposes two sine waves to create a 3D surface:
d = (sin(1:0.2:10)' * cos(1:0.2:10)) * 10;
save("-ascii", "example010.dat", "d");
The data file can then be used to draw the surface three ways:
//draw an instance of the surface
surface(file = "example010.dat", center = true);
//draw another instance, now rotated
translate(v = [70, 0, 0])
  rotate(45, [0, 0, 1])
    surface(file = "example010.dat", center = true);
// and two last instances, intersected
translate(v = [35, 60, 0])
intersection() {
  surface(file = "example010.dat", center = true);
    rotate(45, [0, 0, 1])
      surface(file = "example010.dat", center = true);
}

Image Base Height Maps
[Note: Requires version 2015.03]
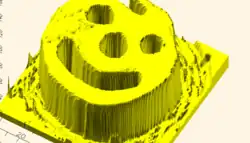
Heights are calculated using the linear luminance for the sRGB color space (Y = 0.2126R + 0.7152G + 0.0722B) at each pixel to derive a Grayscale value, which are further scaled to the range [0:100]. For an image with a color space between black (rgb=0,0,0) and white (rgb=1,1,1) the gray scale will be the full range.
For an image with a a narrower range of colors the gray scale is likewise reduced, and the minimum and maximum luminance in the color range set the lowest and highest limits, respectively, on the surface's heights.
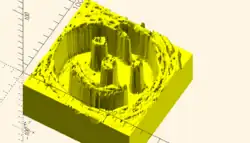
Note also that no base is added below the surface as is done for a data file surface. Squares at Z=0, black, do have a surface filled in so the entire area of the surface is continuous.
Normally, with invert=false, the surface will be drawn upwards from the X-Y plane with black being z=0 increasing up to white=100. When invert=true the shape is still drawn starting at the X-Y plane, but now downwards to white=-100.
Currently only PNG (.png) images are supported and only the RGB channels are used. Specifically, the alpha channel is ignored.
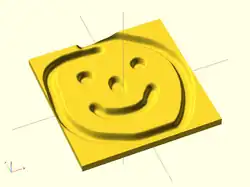
Example Using Invert
// Example 3a - apply a scale to the surface
scale([1, 1, 0.1])
  surface(file = "smiley.png", center = true);
scale([1, 1, 0.1])
  surface(file = "smiley.png", center = true, invert = true);
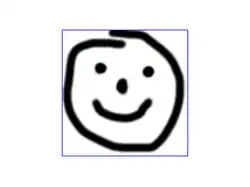
.png)

Note that the surfaces are above or, for the inverted surface, below, the X-Y plane, unlike Example 3
Example Grayscale Effects [Note: Requires version 2015.03]
surface(file = "BRGY-Grey.png", center = true, invert = false);
-
 PNG Test File
 -
 3D Surface