The data files have date is the format i.e. 1975M1, 1975M2, ... 2011M12 for time series data. when plotting this data using R, I want the x-axis to display the months on tick axis.
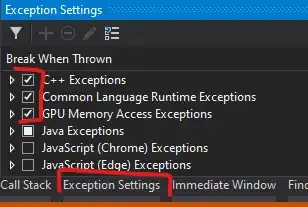
For the dates to be read properly, I have tried replacing the M by - to get %Y-%m format but that doesnt seem good for drawTimeAxis from hydroTSM package which perhaps requires %Y-%M-%d format. It gives error that incorrect number of dimensions for ticks dimension.
Another method of parsing and formatting the data as in x$newdate <- strptime(as.character(x$date), "%Y-%m") and then format(x$newdate,""%Y-%m")
also doesnt read the date and gives error... all NA.
date <- as.Date(data[,1] the error that character string is not in a standard unambiguous format and ts <- read.zoo(xts, as.yearmon(x[,1])) gives bad enries at data rows.
Please give solution of how this data can be read with the date information.
A small subset of the data file
date    x   x2
1975M1  112.44  113.12
1975M2  113.1   114.36
1975M3  115.04  114.81
1975M4  117.65  115.35
1975M5  119.5   116.92
1975M6  121.4   118.56
1975M7  120.64  118.97
1975M8  119.12  119.84
1975M9  118.91  120.59
1975M10 120.58  122.3
1975M11 121.26  123.35
1975M12 122.34  123.33
Update: The answers so far solve the problem of reading the date correctly by using %YM%m in the xts package or adding the day for getting standard format. The customizing of tick axis is still a problem. The drawTimeAxis is giving dimension error and plot commands are not showing monthly labels for more than one year of data or otherwise . Any methods of customizing tick axis ?